

Light Duty Technology Cost Analysis, Power - US Environmental ...
Light Duty Technology Cost Analysis, Power - US Environmental ...
Light Duty Technology Cost Analysis, Power - US Environmental ...

Create successful ePaper yourself
Turn your PDF publications into a flip-book with our unique Google optimized e-Paper software.
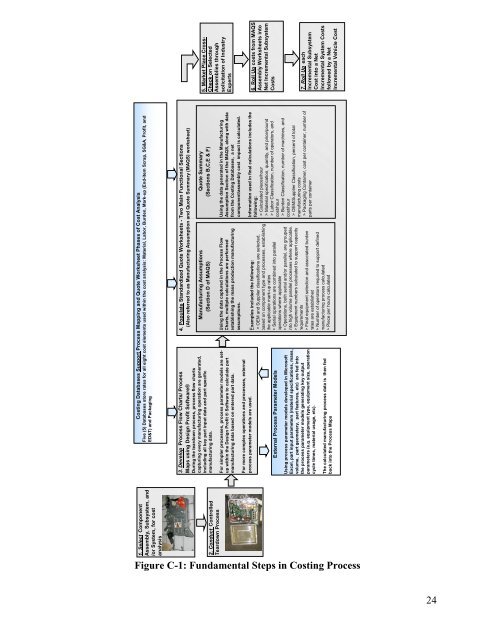
<strong>Cost</strong>ing Databases Support Process Mapping and Quote Worksheet Phases of <strong>Cost</strong> <strong>Analysis</strong><br />
Five (5) Databases store rates for all eight cost elements used within the cost analysis: Material, Labor, Burden, Mark-up (End-item Scrap, SG&A, Profit, and<br />
ED&T) and Packaging<br />
1. Select Component<br />
Assembly, Subsystem, and<br />
/or System, for cost<br />
analysis<br />
4. Populate Standardized Quote Worksheets - Two Main Functional Sections<br />
(Also referred to as Manufacturing Assumption and Quote Summary (MAQS) worksheet)<br />
3. Develop Process Flow Charts/ Process<br />
Maps using Design Profit Software®<br />
During the teardown process, process flow charts<br />
capturing every manufacturing operation are generated,<br />
including all key part input data and part specific<br />
manufacturing data.<br />
5. Market Place Cross-<br />
Check on Selected<br />
Assemblies through<br />
solicitation of Industry<br />
Experts<br />
Quote Summary<br />
(Sections B,C,E & F)<br />
Manufacturing Assumptions<br />
(Section D of MAQS)<br />
2. Conduct Controlled<br />
Teardown Process<br />
Using the data generated in the Manufacturing<br />
Assumption Section of the MAQS, along with data<br />
from the <strong>Cost</strong>ing Databases, a net<br />
component/assembly cost impact is calculated.<br />
Using the data captured in the Process Flow<br />
Charts, multiple calculations are performed<br />
establishing the mass production manufacturing<br />
assumptions.<br />
For simpler processes, process parameter models are setup<br />
within the Design Profit ® Software to calculate part<br />
manufacturing data based on entered part data.<br />
For more complex operations and processes, external<br />
process parameter models are used.<br />
6. Roll Up costs from MAQS<br />
Assembly Worksheets into<br />
Net Incremental Subsystem<br />
<strong>Cost</strong>s<br />
Information used in final calculations includes the<br />
following:<br />
> Calculated pieces/hour<br />
> Material specification, quantity, and price/pound<br />
> Labor Classification, number of operators, and<br />
cost/hour<br />
> Burden Classification, number of machines, and<br />
cost/hour<br />
> OEM/Supplier Classification, percent of total<br />
manufacturing costs<br />
> Packaging Container, cost per container, number of<br />
parts per container<br />
7. Roll Up each<br />
Incremental Subsystem<br />
<strong>Cost</strong> into a Net<br />
Incremental System <strong>Cost</strong>s<br />
followed by a Net<br />
Incremental Vehicle <strong>Cost</strong><br />
Examples included the following:<br />
> OEM and Supplier classifications are selected,<br />
based on component type and processes, establishing<br />
the applicable mark-up rates<br />
> Serial operations are combined into parallel<br />
operations where applicable<br />
> Operations, both serial and/or parallel, are grouped<br />
into high volume parallel processes where applicable.<br />
> Equipment numbers calculated to support capacity<br />
requirements<br />
> Final equipment selection and associated burden<br />
rates are established<br />
> Number of operators required to support defined<br />
manufacturing process calculated<br />
> Piece per hours calculated<br />
External Process Parameter Models<br />
Using process parameter models developed in Microsoft<br />
Excel, part input parameters (material specifications, mass,<br />
volume, part geometery, part features, etc) are fed into<br />
the process parameter models generating key output<br />
parameters (e.g. equipment type, equipment size, operation<br />
cycle times, material usage, etc).<br />
Figure C-1: Fundamental Steps in <strong>Cost</strong>ing Process<br />
The calculated manufacturing process data is then fed<br />
back into the Process Maps<br />
24


