To the Graduate Council: I am submitting herewith a thesis written by ...
To the Graduate Council: I am submitting herewith a thesis written by ...
To the Graduate Council: I am submitting herewith a thesis written by ...
Create successful ePaper yourself
Turn your PDF publications into a flip-book with our unique Google optimized e-Paper software.
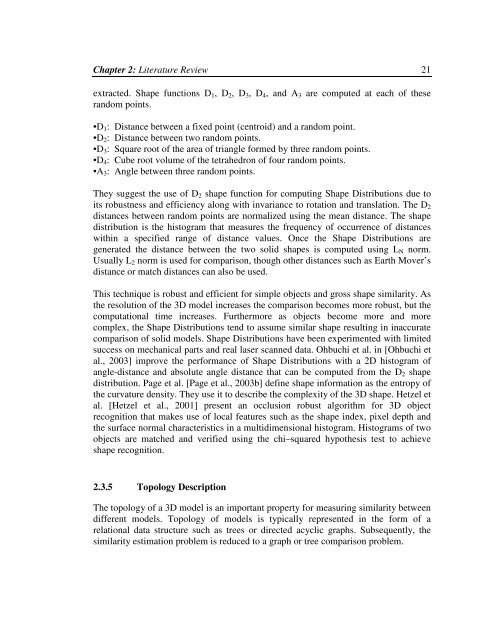
Chapter 2: Literature Review 21extracted. Shape functions D 1 , D 2 , D 3 , D 4 , and A 3 are computed at each of <strong>the</strong>serandom points.•D 1 : Distance between a fixed point (centroid) and a random point.•D 2 : Distance between two random points.•D 3 : Square root of <strong>the</strong> area of triangle formed <strong>by</strong> three random points.•D 4 : Cube root volume of <strong>the</strong> tetrahedron of four random points.•A 3 : Angle between three random points.They suggest <strong>the</strong> use of D 2 shape function for computing Shape Distributions due toits robustness and efficiency along with invariance to rotation and translation. The D 2distances between random points are normalized using <strong>the</strong> mean distance. The shapedistribution is <strong>the</strong> histogr<strong>am</strong> that measures <strong>the</strong> frequency of occurrence of distanceswithin a specified range of distance values. Once <strong>the</strong> Shape Distributions aregenerated <strong>the</strong> distance between <strong>the</strong> two solid shapes is computed using L N norm.Usually L 2 norm is used for comparison, though o<strong>the</strong>r distances such as Earth Mover’sdistance or match distances can also be used.This technique is robust and efficient for simple objects and gross shape similarity. As<strong>the</strong> resolution of <strong>the</strong> 3D model increases <strong>the</strong> comparison becomes more robust, but <strong>the</strong>computational time increases. Fur<strong>the</strong>rmore as objects become more and morecomplex, <strong>the</strong> Shape Distributions tend to assume similar shape resulting in inaccuratecomparison of solid models. Shape Distributions have been experimented with limitedsuccess on mechanical parts and real laser scanned data. Ohbuchi et al. in [Ohbuchi etal., 2003] improve <strong>the</strong> performance of Shape Distributions with a 2D histogr<strong>am</strong> ofangle-distance and absolute angle distance that can be computed from <strong>the</strong> D 2 shapedistribution. Page et al. [Page et al., 2003b] define shape information as <strong>the</strong> entropy of<strong>the</strong> curvature density. They use it to describe <strong>the</strong> complexity of <strong>the</strong> 3D shape. Hetzel etal. [Hetzel et al., 2001] present an occlusion robust algorithm for 3D objectrecognition that makes use of local features such as <strong>the</strong> shape index, pixel depth and<strong>the</strong> surface normal characteristics in a multidimensional histogr<strong>am</strong>. Histogr<strong>am</strong>s of twoobjects are matched and verified using <strong>the</strong> chi–squared hypo<strong>the</strong>sis test to achieveshape recognition.2.3.5 <strong>To</strong>pology DescriptionThe topology of a 3D model is an important property for measuring similarity betweendifferent models. <strong>To</strong>pology of models is typically represented in <strong>the</strong> form of arelational data structure such as trees or directed acyclic graphs. Subsequently, <strong>the</strong>similarity estimation problem is reduced to a graph or tree comparison problem.


