To the Graduate Council: I am submitting herewith a thesis written by ...
To the Graduate Council: I am submitting herewith a thesis written by ...
To the Graduate Council: I am submitting herewith a thesis written by ...
Create successful ePaper yourself
Turn your PDF publications into a flip-book with our unique Google optimized e-Paper software.
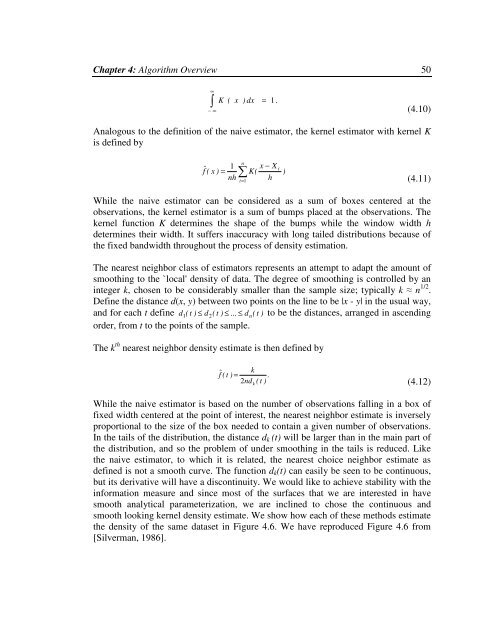
Chapter 4: Algorithm Overview 50∞− ∞K(x) dx= 1 .(4.10)Analogous to <strong>the</strong> definition of <strong>the</strong> naive estimator, <strong>the</strong> kernel estimator with kernel Kis defined <strong>by</strong>fˆ ( x )1=nhni=1x − XK(hi)(4.11)While <strong>the</strong> naive estimator can be considered as a sum of boxes centered at <strong>the</strong>observations, <strong>the</strong> kernel estimator is a sum of bumps placed at <strong>the</strong> observations. Thekernel function K determines <strong>the</strong> shape of <strong>the</strong> bumps while <strong>the</strong> window width hdetermines <strong>the</strong>ir width. It suffers inaccuracy with long tailed distributions because of<strong>the</strong> fixed bandwidth throughout <strong>the</strong> process of density estimation.The nearest neighbor class of estimators represents an attempt to adapt <strong>the</strong> <strong>am</strong>ount ofsmoothing to <strong>the</strong> `local' density of data. The degree of smoothing is controlled <strong>by</strong> aninteger k, chosen to be considerably smaller than <strong>the</strong> s<strong>am</strong>ple size; typically k n 1/2 .Define <strong>the</strong> distance d(x, y) between two points on <strong>the</strong> line to be |x - y| in <strong>the</strong> usual way,and for each t define d 1 ( t ) ≤ d 2 ( t ) ≤ ... ≤ dn( t ) to be <strong>the</strong> distances, arranged in ascendingorder, from t to <strong>the</strong> points of <strong>the</strong> s<strong>am</strong>ple.The k th nearest neighbor density estimate is <strong>the</strong>n defined <strong>by</strong>fˆ ( t )=2kndk( t.)(4.12)While <strong>the</strong> naive estimator is based on <strong>the</strong> number of observations falling in a box offixed width centered at <strong>the</strong> point of interest, <strong>the</strong> nearest neighbor estimate is inverselyproportional to <strong>the</strong> size of <strong>the</strong> box needed to contain a given number of observations.In <strong>the</strong> tails of <strong>the</strong> distribution, <strong>the</strong> distance d k (t) will be larger than in <strong>the</strong> main part of<strong>the</strong> distribution, and so <strong>the</strong> problem of under smoothing in <strong>the</strong> tails is reduced. Like<strong>the</strong> naive estimator, to which it is related, <strong>the</strong> nearest choice neighbor estimate asdefined is not a smooth curve. The function d k (t) can easily be seen to be continuous,but its derivative will have a discontinuity. We would like to achieve stability with <strong>the</strong>information measure and since most of <strong>the</strong> surfaces that we are interested in havesmooth analytical par<strong>am</strong>eterization, we are inclined to chose <strong>the</strong> continuous andsmooth looking kernel density estimate. We show how each of <strong>the</strong>se methods estimate<strong>the</strong> density of <strong>the</strong> s<strong>am</strong>e dataset in Figure 4.6. We have reproduced Figure 4.6 from[Silverman, 1986].


