Compendium of Country Examples and Lessons Learned from ...
Compendium of Country Examples and Lessons Learned from ...
Compendium of Country Examples and Lessons Learned from ...

You also want an ePaper? Increase the reach of your titles
YUMPU automatically turns print PDFs into web optimized ePapers that Google loves.
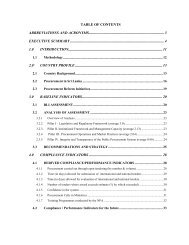
1 = areas where substantive work is needed for the system to meet the st<strong>and</strong>ard;0 = indicates a failure to meet the proposed st<strong>and</strong>ard.Narrative report should provide additional information on changes underway.In case <strong>of</strong> substantive or material gaps, evaluators have to use their pr<strong>of</strong>essional judgment.In some <strong>of</strong> the sub-indicators, internal hierarchies have been formulated to focus on keyprinciples <strong>of</strong> good procurement.Aggregation <strong>of</strong> scoresAll baseline indicators have sub-indicators, which are individually scored, at the subindicatorlevel.The assessor may want to aggregate the scores at the indicator level or pillar level to obtain acompact pr<strong>of</strong>ile <strong>of</strong> strengths <strong>and</strong> weaknesses <strong>of</strong> the system.The need <strong>and</strong> method <strong>of</strong> aggregation is a decision left open to the user. For the mostcomprehensive underst<strong>and</strong>ing <strong>of</strong> the system‟s strengths <strong>and</strong> weaknesses, the sub-indicatorview is the most informative.Benchmarking, compliance <strong>and</strong> performance sheetAnnex 1 to the Methodology contains a Benchmarking Compliance <strong>and</strong> Performance Sheetwhere the assessor can summarise the scores <strong>of</strong> each <strong>of</strong> the baseline indicators <strong>and</strong> enter theresults <strong>of</strong> the performance assessment.A column is provided to include a brief description <strong>of</strong> the situation that justifies the score orwhere to explain the result <strong>of</strong> each compliance indicator.Assessors may also include recommended actions <strong>and</strong> assign priorities.The new marking sheet provides a broad overview <strong>of</strong> the system, the key weaknesses <strong>and</strong>strengths <strong>and</strong> the priorities for action.Scoring can be depicted graphically by way <strong>of</strong> Excel spreadsheets.The following (generic) figures can easily be generated <strong>from</strong> the aforementioned Excel sheet. Theyenable the viewer to quickly see the strengths <strong>and</strong> weaknesses <strong>of</strong> the national procurement system.Figure 2 presents the public procurement system at a glance. It compares the maximum availablescores to those assessed for a country. Figure 3 exhibits the twelve indicators <strong>of</strong> the Methodology,detailing the assessment results at the indicator level.COMPENDIUM OF COUNTRY EXAMPLES AND LESSONS LEARNED […] - OECD 2008 25