Snakes and Ladders - ERU Consultants Pvt. Ltd.
Snakes and Ladders - ERU Consultants Pvt. Ltd.
Snakes and Ladders - ERU Consultants Pvt. Ltd.

You also want an ePaper? Increase the reach of your titles
YUMPU automatically turns print PDFs into web optimized ePapers that Google loves.
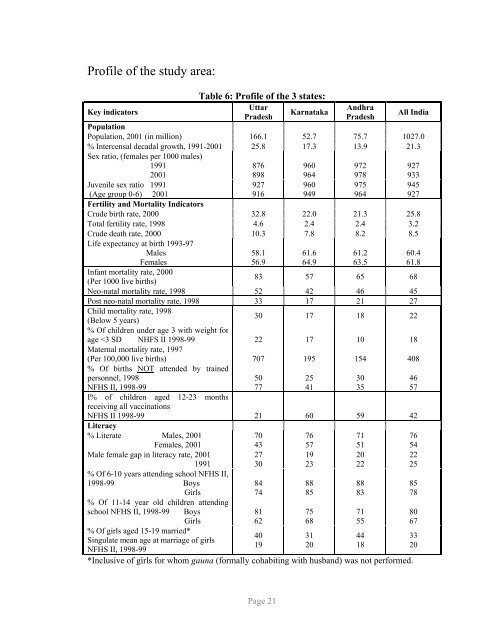
Profile of the study area:<br />
Key indicators<br />
Table 6: Profile of the 3 states:<br />
Uttar<br />
Pradesh<br />
Karnataka<br />
Andhra<br />
Pradesh<br />
All India<br />
Population<br />
Population, 2001 (in million) 166.1 52.7 75.7 1027.0<br />
% Intercensal decadal growth, 1991-2001 25.8 17.3 13.9 21.3<br />
Sex ratio, (females per 1000 males)<br />
1991<br />
876 960 972<br />
927<br />
2001<br />
898 964 978<br />
933<br />
Juvenile sex ratio 1991<br />
927 960 975<br />
945<br />
(Age group 0-6) 2001<br />
Fertility <strong>and</strong> Mortality Indicators<br />
916 949 964<br />
927<br />
Crude birth rate, 2000 32.8 22.0 21.3 25.8<br />
Total fertility rate, 1998 4.6 2.4 2.4 3.2<br />
Crude death rate, 2000<br />
Life expectancy at birth 1993-97<br />
10.3 7.8 8.2 8.5<br />
Males<br />
58.1 61.6 61.2 60.4<br />
Females<br />
56.9 64.9 63.5 61.8<br />
Infant mortality rate, 2000<br />
(Per 1000 live births)<br />
83 57 65 68<br />
Neo-natal mortality rate, 1998 52 42 46 45<br />
Post neo-natal mortality rate, 1998 33 17 21 27<br />
Child mortality rate, 1998<br />
(Below 5 years)<br />
% Of children under age 3 with weight for<br />
30 17 18 22<br />
age