Snakes and Ladders - ERU Consultants Pvt. Ltd.
Snakes and Ladders - ERU Consultants Pvt. Ltd.
Snakes and Ladders - ERU Consultants Pvt. Ltd.

You also want an ePaper? Increase the reach of your titles
YUMPU automatically turns print PDFs into web optimized ePapers that Google loves.
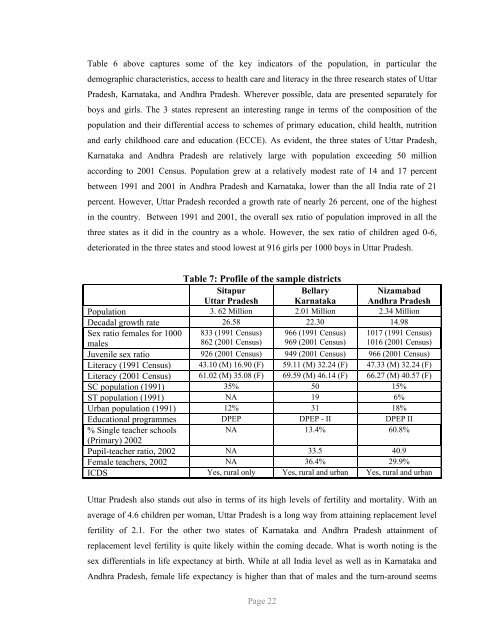
Table 6 above captures some of the key indicators of the population, in particular the<br />
demographic characteristics, access to health care <strong>and</strong> literacy in the three research states of Uttar<br />
Pradesh, Karnataka, <strong>and</strong> Andhra Pradesh. Wherever possible, data are presented separately for<br />
boys <strong>and</strong> girls. The 3 states represent an interesting range in terms of the composition of the<br />
population <strong>and</strong> their differential access to schemes of primary education, child health, nutrition<br />
<strong>and</strong> early childhood care <strong>and</strong> education (ECCE). As evident, the three states of Uttar Pradesh,<br />
Karnataka <strong>and</strong> Andhra Pradesh are relatively large with population exceeding 50 million<br />
according to 2001 Census. Population grew at a relatively modest rate of 14 <strong>and</strong> 17 percent<br />
between 1991 <strong>and</strong> 2001 in Andhra Pradesh <strong>and</strong> Karnataka, lower than the all India rate of 21<br />
percent. However, Uttar Pradesh recorded a growth rate of nearly 26 percent, one of the highest<br />
in the country. Between 1991 <strong>and</strong> 2001, the overall sex ratio of population improved in all the<br />
three states as it did in the country as a whole. However, the sex ratio of children aged 0-6,<br />
deteriorated in the three states <strong>and</strong> stood lowest at 916 girls per 1000 boys in Uttar Pradesh.<br />
Table 7: Profile of the sample districts<br />
Sitapur<br />
Bellary<br />
Nizamabad<br />
Uttar Pradesh Karnataka Andhra Pradesh<br />
Population 3. 62 Million 2.01 Million 2.34 Million<br />
Decadal growth rate 26.58 22.30 14.98<br />
Sex ratio females for 1000 833 (1991 Census) 966 (1991 Census) 1017 (1991 Census)<br />
males<br />
862 (2001 Census) 969 (2001 Census) 1016 (2001 Census)<br />
Juvenile sex ratio 926 (2001 Census) 949 (2001 Census) 966 (2001 Census)<br />
Literacy (1991 Census) 43.10 (M) 16.90 (F) 59.11 (M) 32.24 (F) 47.33 (M) 32.24 (F)<br />
Literacy (2001 Census) 61.02 (M) 35.08 (F) 69.59 (M) 46.14 (F) 66.27 (M) 40.57 (F)<br />
SC population (1991) 35% 50 15%<br />
ST population (1991) NA 19 6%<br />
Urban population (1991) 12% 31 18%<br />
Educational programmes DPEP DPEP - II DPEP II<br />
% Single teacher schools<br />
(Primary) 2002<br />
NA 13.4% 60.8%<br />
Pupil-teacher ratio, 2002 NA 33.5 40.9<br />
Female teachers, 2002 NA 36.4% 29.9%<br />
ICDS Yes, rural only Yes, rural <strong>and</strong> urban Yes, rural <strong>and</strong> urban<br />
Uttar Pradesh also st<strong>and</strong>s out also in terms of its high levels of fertility <strong>and</strong> mortality. With an<br />
average of 4.6 children per woman, Uttar Pradesh is a long way from attaining replacement level<br />
fertility of 2.1. For the other two states of Karnataka <strong>and</strong> Andhra Pradesh attainment of<br />
replacement level fertility is quite likely within the coming decade. What is worth noting is the<br />
sex differentials in life expectancy at birth. While at all India level as well as in Karnataka <strong>and</strong><br />
Andhra Pradesh, female life expectancy is higher than that of males <strong>and</strong> the turn-around seems<br />
Page 22