Thermal applicability of two-phase thermosyphons in ... - LEPTEN
Thermal applicability of two-phase thermosyphons in ... - LEPTEN
Thermal applicability of two-phase thermosyphons in ... - LEPTEN

You also want an ePaper? Increase the reach of your titles
YUMPU automatically turns print PDFs into web optimized ePapers that Google loves.
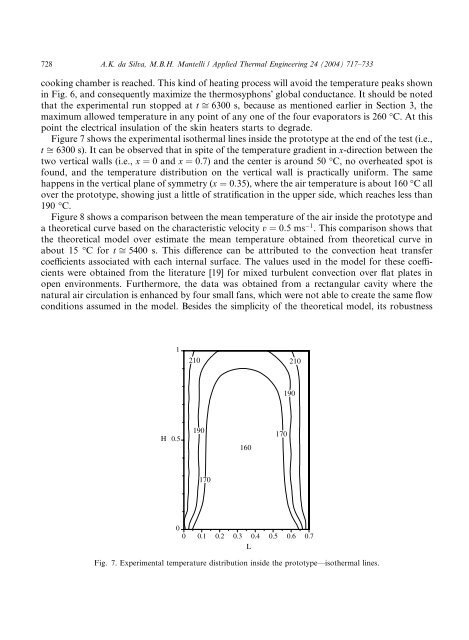
728 A.K. da Silva, M.B.H. Mantelli / Applied <strong>Thermal</strong> Eng<strong>in</strong>eer<strong>in</strong>g 24 (2004) 717–733cook<strong>in</strong>g chamber is reached. This k<strong>in</strong>d <strong>of</strong> heat<strong>in</strong>g process will avoid the temperature peaks shown<strong>in</strong> Fig. 6, and consequently maximize the <strong>thermosyphons</strong>Õ global conductance. It should be notedthat the experimental run stopped at t ffi 6300 s, because as mentioned earlier <strong>in</strong> Section 3, themaximum allowed temperature <strong>in</strong> any po<strong>in</strong>t <strong>of</strong> any one <strong>of</strong> the four evaporators is 260 °C. At thispo<strong>in</strong>t the electrical <strong>in</strong>sulation <strong>of</strong> the sk<strong>in</strong> heaters starts to degrade.Figure 7 shows the experimental isothermal l<strong>in</strong>es <strong>in</strong>side the prototype at the end <strong>of</strong> the test (i.e.,t ffi 6300 s). It can be observed that <strong>in</strong> spite <strong>of</strong> the temperature gradient <strong>in</strong> x-direction between the<strong>two</strong> vertical walls (i.e., x ¼ 0 and x ¼ 0:7) and the center is around 50 °C, no overheated spot isfound, and the temperature distribution on the vertical wall is practically uniform. The samehappens <strong>in</strong> the vertical plane <strong>of</strong> symmetry (x ¼ 0:35), where the air temperature is about 160 °C allover the prototype, show<strong>in</strong>g just a little <strong>of</strong> stratification <strong>in</strong> the upper side, which reaches less than190 °C.Figure 8 shows a comparison between the mean temperature <strong>of</strong> the air <strong>in</strong>side the prototype anda theoretical curve based on the characteristic velocity v ¼ 0:5 ms 1 . This comparison shows thatthe theoretical model over estimate the mean temperature obta<strong>in</strong>ed from theoretical curve <strong>in</strong>about 15 °C for t ffi 5400 s. This difference can be attributed to the convection heat transfercoefficients associated with each <strong>in</strong>ternal surface. The values used <strong>in</strong> the model for these coefficientswere obta<strong>in</strong>ed from the literature [19] for mixed turbulent convection over flat plates <strong>in</strong>open environments. Furthermore, the data was obta<strong>in</strong>ed from a rectangular cavity where thenatural air circulation is enhanced by four small fans, which were not able to create the same flowconditions assumed <strong>in</strong> the model. Besides the simplicity <strong>of</strong> the theoretical model, its robustness1210 210190H0.519016017017000 0.1 0.2 0.3 0.4 0.5 0.6 0.7LFig. 7. Experimental temperature distribution <strong>in</strong>side the prototype––isothermal l<strong>in</strong>es.