- Page 2 and 3:
cinematographytheory and practiceim
- Page 4 and 5:
cinematographytheory and practiceim
- Page 6 and 7:
contentsIntroductionThe Scope of th
- Page 8 and 9:
lighting sources 129The Tools of Li
- Page 10 and 11:
Video Exposure 198The Tools 199The
- Page 12 and 13:
optics & focus 269Physical Basis Of
- Page 14 and 15:
INTRODUCTIONTo a great extent the k
- Page 16 and 17:
writing with motion© 2012 Elsevier
- Page 18 and 19:
Figures 1.2 through 1.5. Visual ele
- Page 20 and 21:
a T-shirt, even though it hardly se
- Page 22 and 23:
factors involved: contrast and shar
- Page 24 and 25:
TextureThese days, we rarely shoot
- Page 26 and 27:
Figure 1.24. (top) This scene fromC
- Page 28 and 29:
Film is a dream — but whose?Bruce
- Page 30 and 31:
Figure 2.2. To convey the sense oft
- Page 32 and 33:
The Shots: Building Blocks of a Sce
- Page 34 and 35:
Figures 2.5 and 2.6. Ever the maste
- Page 36 and 37:
Close-upsClose-ups are one of the m
- Page 38 and 39:
Figure 2.15. (above) An atmospheric
- Page 40 and 41:
InsertsAn insert is an isolated, se
- Page 42 and 43:
Figure 2.23. A master shot fromRoni
- Page 44 and 45:
Overlapping or Triple-Take MethodTh
- Page 46 and 47:
Shooting the Freeform MethodHere’
- Page 48 and 49:
INVOLVING THE AUDIENCE: POVRecall t
- Page 50 and 51:
More subjectiveMore subjectiveMore
- Page 52 and 53:
visual language© 2012 Elsevier Inc
- Page 54 and 55:
Figure 3.3. (top) Balance plays a r
- Page 56 and 57:
Texture tors,texture gives
- Page 58 and 59:
Left/RightLargely a result of cultu
- Page 60 and 61:
FORCES OF VISUAL ORGANIZATIONAll of
- Page 62 and 63:
Figure 3.16. (top) The sinuous S an
- Page 64 and 65:
Open and Closed FrameAn open frame
- Page 66 and 67:
Figure 3.25. (above) The rule ofthi
- Page 68 and 69:
language of the lens© 2012 Elsevie
- Page 70 and 71:
Figure 4.3. The wide lens creates a
- Page 72 and 73:
shots and action sequences. The lim
- Page 74 and 75:
Manipulating PerspectiveThere are m
- Page 76 and 77:
Selective FocusThe characteristic o
- Page 78 and 79:
IMAGE CONTROL AT THE LENSSome techn
- Page 80 and 81:
Low AngleA low-angle shot can make
- Page 82 and 83:
visual storytelling© 2012 Elsevier
- Page 84 and 85:
penetrates the dusty darkness of ig
- Page 86 and 87:
Figure 5.6. The black-and-whitefilm
- Page 88 and 89:
Figure 5.11. (top) The Judge, themo
- Page 90 and 91:
Figure 5.21. (above) The momentbefo
- Page 92 and 93:
cinematic continuity© 2012 Elsevie
- Page 94 and 95:
As discussed in Shooting Methods, t
- Page 96 and 97:
over some of that move. To just ski
- Page 98 and 99:
Figure 6.14. The line established b
- Page 100 and 101:
audience. That is its only reason f
- Page 102 and 103:
Figure 6.22. In this scene of a cou
- Page 104 and 105:
Figure 6.25. The 20% rule and the30
- Page 106 and 107:
Prop Continuity in CoverageThe prin
- Page 108 and 109:
Look Establishes New LineIn a relat
- Page 110 and 111:
INTRODUCTIONSWhen you are bringing
- Page 112 and 113:
Figures 6.45. (top) A dramatic ands
- Page 114 and 115:
As discussed in Shooting Methods, s
- Page 116 and 117:
Figure 6.51 (top). In 2001: A Space
- Page 118 and 119:
lighting basics© 2012 Elsevier Inc
- Page 120 and 121:
to a neutral card. This would likel
- Page 122 and 123:
Figure 7.5. (top) Lighting can crea
- Page 124 and 125:
Soft light: Light from a large sour
- Page 126 and 127:
Figure 7.11. (top) Flat front light
- Page 128 and 129:
— from very light, almost translu
- Page 130 and 131:
Figure 7.18. Blown out windows ands
- Page 132 and 133:
Ambient Plus Accentsevery corner of
- Page 134 and 135:
Available Light WindowsWindow light
- Page 136 and 137:
Carrying a LampOften we want the la
- Page 138 and 139:
Figure 7.31. (top) If the practical
- Page 140 and 141:
danger here is your background: sin
- Page 142 and 143:
Figure 7.36. (top) Direct sunlight
- Page 144 and 145:
lighting sources© 2012 Elsevier In
- Page 146 and 147:
BallastsAll HMIs require a ballast,
- Page 148 and 149:
Figure 8.6. Larry Mole Parker ofMol
- Page 150 and 151:
the holder. Contamination will incr
- Page 152 and 153:
TennersThe 10K tungsten Fresnel com
- Page 154 and 155:
go from a very wide beam to a very
- Page 156 and 157:
Figure 8.21. (top) Barger Baglights
- Page 158 and 159: Cycs, Strips, Nooks and BroadsWhen
- Page 160 and 161: Figure 8.28. (above) A Mini Musco i
- Page 162 and 163: HD cinematography© 2012 Elsevier I
- Page 164 and 165: 10075HighlightsFigure 9.2. An analo
- Page 166 and 167: DIGITAL VIDEODigital video exists i
- Page 168 and 169: Lossy and Lossless CompressionA los
- Page 170 and 171: Figure 9.7. (top) SMPTE 75% colorba
- Page 172 and 173: 104° Red61° Magenta167° Yellow0
- Page 174 and 175: Video Noise and GrainMotion picture
- Page 176 and 177: Figure 9.15. Component outputson th
- Page 178 and 179: Figure 9.17. Blue-only color barssh
- Page 180 and 181: Figure 9.21. (above) The Chromadu M
- Page 182 and 183: The Decision MatrixHere’s an orga
- Page 184 and 185: Figure 9.24. (top) The timecodepane
- Page 186 and 187: TAPELESS PRODUCTIONOne advantage (i
- Page 188 and 189: Cineon and DPX FilesOriginally crea
- Page 190 and 191: Figure 9.30. (top) A gradient grays
- Page 192 and 193: Figure 9.35. (top) Shot on thecamer
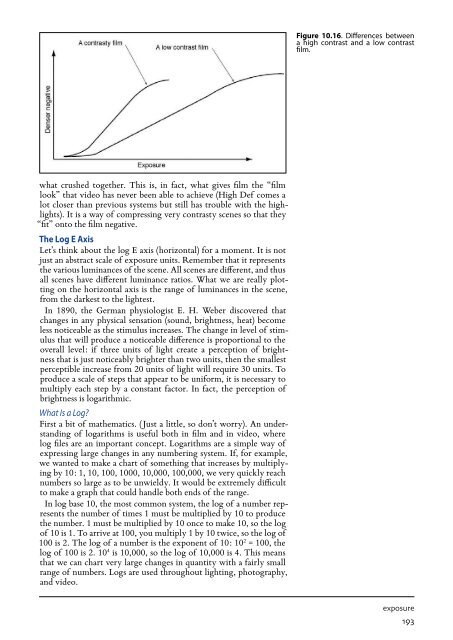
- Page 194 and 195: CONTROLLING THE HD IMAGECertain bas
- Page 196 and 197: exposure© 2012 Elsevier Inc. All r
- Page 198 and 199: close down the iris to a small open
- Page 200 and 201: The Bottom LineHere’s the key poi
- Page 202 and 203: one whole f/stop, we double the qua
- Page 204 and 205: the lower the light level the film
- Page 206 and 207: Figure 10.14. The Hurter andDriffie
- Page 210 and 211: The total brightness range of the s
- Page 212 and 213: ABCDEFFigure 10.20. Exposure on fil
- Page 214 and 215: more critical in video than in film
- Page 216 and 217: “blinding white,” and so on. We
- Page 218 and 219: Zones in a SceneExamine a typical s
- Page 220 and 221: meter. The two readings should be t
- Page 222 and 223: ViewfinderMirror(closed section)Ope
- Page 224 and 225: camera movement© 2012 Elsevier Inc
- Page 226 and 227: Figure 11.2. A Chapman Lenny Armrig
- Page 228 and 229: Figure 11.3. A very simple pipe dol
- Page 230 and 231: Circle Track MovesWhen ordering a d
- Page 232 and 233: Dutch HeadDutch angle is when the c
- Page 234 and 235: front wheels are locked in and func
- Page 236 and 237: Crane/Jib ArmA crane is any camera
- Page 238 and 239: CAR SHOTSCar shots have always been
- Page 240 and 241: SteadicamThe Steadicam revolutioniz
- Page 242 and 243: color© 2012 Elsevier Inc. All righ
- Page 244 and 245: Functions of the EyeThere are many
- Page 246 and 247: creates white. The human eye has re
- Page 251 and 252: Red/Blue Axis(Color Temperature)Neu
- Page 253 and 254: Figure 12.19. Strong monochromaticc
- Page 255 and 256: Figure 12.21. This shot from FightC
- Page 257 and 258: STRATEGIES FOR DEALING WITH EXISTIN
- Page 259 and 260:
Table 12.5. Gels can be used to cor
- Page 261 and 262:
Figure 13.1. (previous page) CCE,a
- Page 263 and 264:
Push processing tends to increase c
- Page 265 and 266:
Skip BleachSkip-Bleach bleach
- Page 267 and 268:
Other Image Control TechniquesCross
- Page 269 and 270:
Figure 13.4. The distinctive lookof
- Page 271 and 272:
Output0255255255InputInput3D LUTsti
- Page 273 and 274:
Figure 13.10. (left) The image with
- Page 275 and 276:
Figure 13.18. (top, near right) The
- Page 277 and 278:
Figure 13.22. (top) An 85B.Figure 1
- Page 279 and 280:
Table 13.5. Effects of filters in b
- Page 281 and 282:
Figure 13.27. (top) Scene with nofi
- Page 283 and 284:
Figure 13.31. The distinctive looki
- Page 285 and 286:
Figure 14.1. (previous page)Extreme
- Page 287 and 288:
Figure 14.4. Refraction.FOCUSFocus
- Page 289 and 290:
Figure 14.6. How iris openingaffect
- Page 291 and 292:
Figure 14.8. Deep focus (extremedep
- Page 293 and 294:
Lens focus set at infinityHyperfoca
- Page 295 and 296:
Figure 14.11. (top) In both of thes
- Page 297 and 298:
Figure 14.15. A split diopter gives
- Page 299 and 300:
Figure 14.16. (top) A snorkle syste
- Page 301 and 302:
photographed by the video camera se
- Page 303 and 304:
Figure 15.1. (previous page) A typi
- Page 305 and 306:
Figure 15.3. DP Tom Denove usinga s
- Page 307 and 308:
Figure 15.5. (top) Attaching a filt
- Page 309 and 310:
Figure 15.8. (top) Types of toemark
- Page 311 and 312:
Figure 15.12. Timecode slating with
- Page 313 and 314:
Figure 15.14. SteadiCam or handheld
- Page 315 and 316:
Figure 15.16. When shooting out int
- Page 317 and 318:
Figure 15.18. Chief Lighting Techni
- Page 319 and 320:
Figure 15.20. A common slatingmista
- Page 321 and 322:
Figure 15.22. (top) A 40 foot light
- Page 323 and 324:
Figure 16.1. (previous page) A comp
- Page 325 and 326:
wave form of the power supply by sq
- Page 327 and 328:
SHOOTING PROCESS PHOTOGRAPHYGreensc
- Page 329 and 330:
Figure 16.3. (top) A large bluescre
- Page 331 and 332:
Figure 16.8. A very large bluescree
- Page 333 and 334:
completely independent of the frame
- Page 335 and 336:
Figure 16.9. The Photo-Sonics 4B,ca
- Page 337 and 338:
Figure 16.11. Without smoke andrain
- Page 339 and 340:
Figure 16.14. (above) The Thundervo
- Page 341 and 342:
consuming process. Also, a licensed
- Page 343 and 344:
Figure 16.18. The lighting effectsh
- Page 345 and 346:
Figure 16.19. A sun path chart fora
- Page 347 and 348:
Figure 16.20. A grayscale and color
- Page 349 and 350:
Figure 16.22. Framing chart forvide
- Page 351 and 352:
Figure 17.1. (previous page) AnImax
- Page 353 and 354:
Figure 17.9. A 2.20:1 widescreenasp
- Page 355 and 356:
Widescreen 1.85:1Cinemascope 2.35:1
- Page 357 and 358:
Figure 17.17. A graphic comparisono
- Page 359 and 360:
ibliographyAdams, Ansel. The Negati
- Page 361 and 362:
This page intentionally left blank
- Page 363 and 364:
Best boy electric (second electric)
- Page 365 and 366:
Color temperature, 231, 235-237, 25
- Page 367 and 368:
Dolly left/right, 218Domino, 115Doo
- Page 369 and 370:
4K HMI units, 134400 Blows, The, 96
- Page 371 and 372:
Interframe compression, 153, 173Int
- Page 373 and 374:
diopters, 283-284exposure compensat
- Page 375 and 376:
Photopic (daytime) vision, 228-229P
- Page 377 and 378:
Sides, 304Signal, video, 160-162Sil
- Page 379 and 380:
Umbrellas, camera, 324Unbalanced fr
- Page 381 and 382:
This page intentionally left blank
- Page 383 and 384:
This page intentionally left blank
- Page 385:
Also by Blain Brownand available fr