2007 / 2008 Annual Report - Eastern Cape Development Corporation
2007 / 2008 Annual Report - Eastern Cape Development Corporation
2007 / 2008 Annual Report - Eastern Cape Development Corporation
- No tags were found...

Create successful ePaper yourself
Turn your PDF publications into a flip-book with our unique Google optimized e-Paper software.
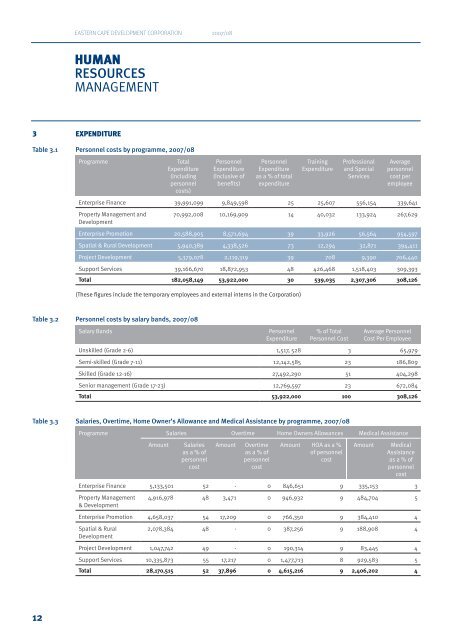
EASTERN CAPE DEVELOPMENT CORPORATION <strong>2007</strong>/08HUMANRESOURCESMANAGEMENT3 EXPENDITURETable 3.1 Personnel costs by programme, <strong>2007</strong>/08ProgrammeTotalExpenditure(includingpersonnelcosts)PersonnelExpenditure(Inclusive ofbenefits)PersonnelExpenditureas a % of totalexpenditureTrainingExpenditureProfessionaland SpecialServicesAveragepersonnelcost peremployeeEnterprise Finance 39,991,099 9,849,598 25 25,607 556,154 339,641Property Management and<strong>Development</strong>70,992,008 10,169,909 14 40,032 133,924 267,629Enterprise Promotion 20,588,905 8,571,694 39 33,926 56,564 954,597Spatial & Rural <strong>Development</strong> 5,940,389 4,338,526 73 12,294 32,871 394,411Project <strong>Development</strong> 5,379,078 2,119,319 39 708 9,390 706,440Support Services 39,166,670 18,872,953 48 426,468 1,518,403 309,393Total 182,058,149 53,922,000 30 539,035 2,307,306 308,126(These figures include the temporary employees and external interns in the <strong>Corporation</strong>)Table 3.2 Personnel costs by salary bands, <strong>2007</strong>/08Salary BandsPersonnelExpenditure% of TotalPersonnel CostAverage PersonnelCost Per EmployeeUnskilled (Grade 2-6) 1,517, 528 3 65,979Semi-skilled (Grade 7-11) 12,142,585 23 186,809Skilled (Grade 12-16) 27,492,290 51 404,298Senior management (Grade 17-23) 12,769,597 23 672,084Total 53,922,000 100 308,126Table 3.3 Salaries, Overtime, Home Owner’s Allowance and Medical Assistance by programme, <strong>2007</strong>/08Programme Salaries Overtime Home Owners Allowances Medical AssistanceAmountSalariesas a % ofpersonnelcostAmountOvertimeas a % ofpersonnelcostAmount HOA as a %of personnelcostAmountMedicalAssistanceas a % ofpersonnelcostEnterprise Finance 5,133,501 52 - 0 846,651 9 335,153 3Property Management& <strong>Development</strong>4,916,978 48 3,471 0 946,932 9 484,704 5Enterprise Promotion 4,658,037 54 17,209 0 766,350 9 384,410 4Spatial & Rural<strong>Development</strong>2,078,384 48 - 0 387,256 9 188,908 4Project <strong>Development</strong> 1,047,742 49 - 0 190,314 9 83,445 4Support Services 10,335,873 55 17,217 0 1,477,713 8 929,583 5Total 28,170,515 52 37,896 0 4,615,216 9 2,406,202 412