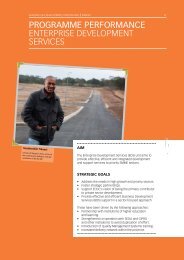
2007 / 2008 Annual Report - Eastern Cape Development Corporation
2007 / 2008 Annual Report - Eastern Cape Development Corporation
2007 / 2008 Annual Report - Eastern Cape Development Corporation
- No tags were found...

You also want an ePaper? Increase the reach of your titles
YUMPU automatically turns print PDFs into web optimized ePapers that Google loves.
EASTERN CAPE DEVELOPMENT CORPORATION <strong>2007</strong>/08NOTES TO THECONSOLIDATED ANNUAL FINANCIAL STATEMENTSFOR THE YEAR ENDED 31 MARCH <strong>2008</strong>6 Loans to / (from) subsidiaries and associates (continued)Except for the loans with the Centre for Investment and Marketing in the <strong>Eastern</strong> <strong>Cape</strong> (Association incorporatedunder section 21) and Transdev Properties (Proprietary) Limited, which bear interest as disclosed above, all loans areunsecured, do not bear interest and have no fixed terms of repayment.AssociatesBushman Sands <strong>Development</strong>s (Proprietary) LimitedThe loan is secured by surety from the Mantis Group, bears interest at prime plus 1%and is repayable by 30 June 2012.Worthytrade 93 (Proprietary) LimitedCHMF Briquettes (Proprietary) LimitedNan-Shen Foods (Proprietary) LimitedSubtotalImpairment of loans to subsidiaries<strong>2008</strong>R’00035,946Group4,333--40,279(9,841)<strong>2007</strong>R’00033,5334,3332837,876(9,129)<strong>2008</strong>R’000<strong>Corporation</strong>35,9464,333--40,279(9,841)Total loans to / (from) associates 30,438 28,747 30,438 28,747Non-current assetsNon-current liabilities7 Investments33,765-28,782-55,297(56,623)<strong>2007</strong>R’00033,5334,333--37,866(9,119)57,620(52,031)33,765 28,782 (1,326) 5,589Available for saleListed sharesUnlisted shares72382,7707304,700-82,770-4,70083,493 5,430 82,770 4,700Held to maturityFixed term investmentsOther investments48,78911,89143,49410,89548,78911,89143,49410,89560,680 54,389 60,680 54,389Total investments 144,173 59,819 143,450 59,089Analysis of available-for-sale investmentsListed shares at fair valueUnlisted shares at costUnlisted shares at fair value7237,77075,0007303,879821-7,77075,000-3,87982183,493 5,430 82,770 4,700Non-current assetsAvailable for saleHeld to maturity83,49360,6805,43054,38982,77060,6804,70054,389144,173 59,819 143,450 59,089Total amount of change in fair value recognised directly in equity (Note 13) 74,173 - 74,180 -88