Mapping Cultural Participation in Chicago - Cultural Policy Center
Mapping Cultural Participation in Chicago - Cultural Policy Center
Mapping Cultural Participation in Chicago - Cultural Policy Center

Create successful ePaper yourself
Turn your PDF publications into a flip-book with our unique Google optimized e-Paper software.
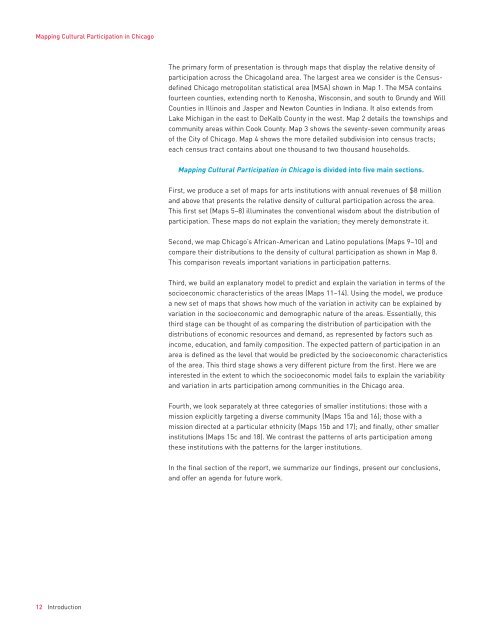
<strong>Mapp<strong>in</strong>g</strong> <strong>Cultural</strong> <strong>Participation</strong> <strong>in</strong> <strong>Chicago</strong>The primary form of presentation is through maps that display the relative density ofparticipation across the <strong>Chicago</strong>land area. The largest area we consider is the Censusdef<strong>in</strong>ed<strong>Chicago</strong> metropolitan statistical area (MSA) shown <strong>in</strong> Map 1. The MSA conta<strong>in</strong>sfourteen counties, extend<strong>in</strong>g north to Kenosha, Wiscons<strong>in</strong>, and south to Grundy and WillCounties <strong>in</strong> Ill<strong>in</strong>ois and Jasper and Newton Counties <strong>in</strong> Indiana. It also extends fromLake Michigan <strong>in</strong> the east to DeKalb County <strong>in</strong> the west. Map 2 details the townships andcommunity areas with<strong>in</strong> Cook County. Map 3 shows the seventy-seven community areasof the City of <strong>Chicago</strong>. Map 4 shows the more detailed subdivision <strong>in</strong>to census tracts;each census tract conta<strong>in</strong>s about one thousand to two thousand households.<strong>Mapp<strong>in</strong>g</strong> <strong>Cultural</strong> <strong>Participation</strong> <strong>in</strong> <strong>Chicago</strong> is divided <strong>in</strong>to five ma<strong>in</strong> sections.First, we produce a set of maps for arts <strong>in</strong>stitutions with annual revenues of $8 millionand above that presents the relative density of cultural participation across the area.This first set (Maps 5–8) illum<strong>in</strong>ates the conventional wisdom about the distribution ofparticipation. These maps do not expla<strong>in</strong> the variation; they merely demonstrate it.Second, we map <strong>Chicago</strong>’s African-American and Lat<strong>in</strong>o populations (Maps 9–10) andcompare their distributions to the density of cultural participation as shown <strong>in</strong> Map 8.This comparison reveals important variations <strong>in</strong> participation patterns.Third, we build an explanatory model to predict and expla<strong>in</strong> the variation <strong>in</strong> terms of thesocioeconomic characteristics of the areas (Maps 11–14). Us<strong>in</strong>g the model, we producea new set of maps that shows how much of the variation <strong>in</strong> activity can be expla<strong>in</strong>ed byvariation <strong>in</strong> the socioeconomic and demographic nature of the areas. Essentially, thisthird stage can be thought of as compar<strong>in</strong>g the distribution of participation with thedistributions of economic resources and demand, as represented by factors such as<strong>in</strong>come, education, and family composition. The expected pattern of participation <strong>in</strong> anarea is def<strong>in</strong>ed as the level that would be predicted by the socioeconomic characteristicsof the area. This third stage shows a very different picture from the first. Here we are<strong>in</strong>terested <strong>in</strong> the extent to which the socioeconomic model fails to expla<strong>in</strong> the variabilityand variation <strong>in</strong> arts participation among communities <strong>in</strong> the <strong>Chicago</strong> area.Fourth, we look separately at three categories of smaller <strong>in</strong>stitutions: those with amission explicitly target<strong>in</strong>g a diverse community (Maps 15a and 16); those with amission directed at a particular ethnicity (Maps 15b and 17); and f<strong>in</strong>ally, other smaller<strong>in</strong>stitutions (Maps 15c and 18). We contrast the patterns of arts participation amongthese <strong>in</strong>stitutions with the patterns for the larger <strong>in</strong>stitutions.In the f<strong>in</strong>al section of the report, we summarize our f<strong>in</strong>d<strong>in</strong>gs, present our conclusions,and offer an agenda for future work.12 Introduction