Mapping Cultural Participation in Chicago - Cultural Policy Center
Mapping Cultural Participation in Chicago - Cultural Policy Center
Mapping Cultural Participation in Chicago - Cultural Policy Center

You also want an ePaper? Increase the reach of your titles
YUMPU automatically turns print PDFs into web optimized ePapers that Google loves.
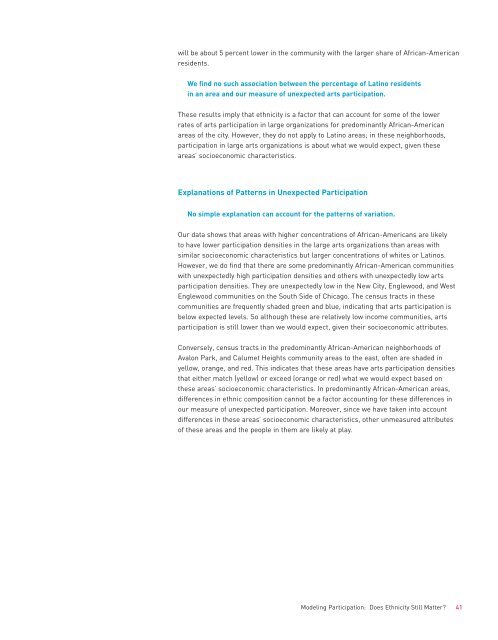
will be about 5 percent lower <strong>in</strong> the community with the larger share of African-Americanresidents.We f<strong>in</strong>d no such association between the percentage of Lat<strong>in</strong>o residents<strong>in</strong> an area and our measure of unexpected arts participation.These results imply that ethnicity is a factor that can account for some of the lowerrates of arts participation <strong>in</strong> large organizations for predom<strong>in</strong>antly African-Americanareas of the city. However, they do not apply to Lat<strong>in</strong>o areas; <strong>in</strong> these neighborhoods,participation <strong>in</strong> large arts organizations is about what we would expect, given theseareas’ socioeconomic characteristics.Explanations of Patterns <strong>in</strong> Unexpected <strong>Participation</strong>No simple explanation can account for the patterns of variation.Our data shows that areas with higher concentrations of African-Americans are likelyto have lower participation densities <strong>in</strong> the large arts organizations than areas withsimilar socioeconomic characteristics but larger concentrations of whites or Lat<strong>in</strong>os.However, we do f<strong>in</strong>d that there are some predom<strong>in</strong>antly African-American communitieswith unexpectedly high participation densities and others with unexpectedly low artsparticipation densities. They are unexpectedly low <strong>in</strong> the New City, Englewood, and WestEnglewood communities on the South Side of <strong>Chicago</strong>. The census tracts <strong>in</strong> thesecommunities are frequently shaded green and blue, <strong>in</strong>dicat<strong>in</strong>g that arts participation isbelow expected levels. So although these are relatively low <strong>in</strong>come communities, artsparticipation is still lower than we would expect, given their socioeconomic attributes.Conversely, census tracts <strong>in</strong> the predom<strong>in</strong>antly African-American neighborhoods ofAvalon Park, and Calumet Heights community areas to the east, often are shaded <strong>in</strong>yellow, orange, and red. This <strong>in</strong>dicates that these areas have arts participation densitiesthat either match (yellow) or exceed (orange or red) what we would expect based onthese areas’ socioeconomic characteristics. In predom<strong>in</strong>antly African-American areas,differences <strong>in</strong> ethnic composition cannot be a factor account<strong>in</strong>g for these differences <strong>in</strong>our measure of unexpected participation. Moreover, s<strong>in</strong>ce we have taken <strong>in</strong>to accountdifferences <strong>in</strong> these areas’ socioeconomic characteristics, other unmeasured attributesof these areas and the people <strong>in</strong> them are likely at play.Model<strong>in</strong>g <strong>Participation</strong>: Does Ethnicity Still Matter? 41