Mapping Cultural Participation in Chicago - Cultural Policy Center
Mapping Cultural Participation in Chicago - Cultural Policy Center
Mapping Cultural Participation in Chicago - Cultural Policy Center

Create successful ePaper yourself
Turn your PDF publications into a flip-book with our unique Google optimized e-Paper software.
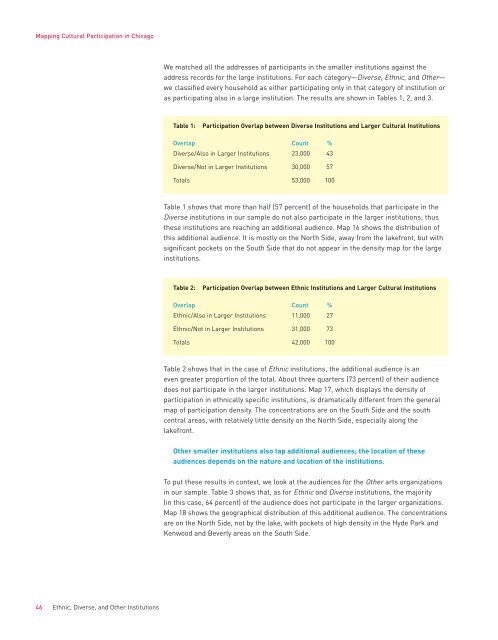
<strong>Mapp<strong>in</strong>g</strong> <strong>Cultural</strong> <strong>Participation</strong> <strong>in</strong> <strong>Chicago</strong>We matched all the addresses of participants <strong>in</strong> the smaller <strong>in</strong>stitutions aga<strong>in</strong>st theaddress records for the large <strong>in</strong>stitutions. For each category—Diverse, Ethnic, and Other—we classified every household as either participat<strong>in</strong>g only <strong>in</strong> that category of <strong>in</strong>stitution oras participat<strong>in</strong>g also <strong>in</strong> a large <strong>in</strong>stitution. The results are shown <strong>in</strong> Tables 1, 2, and 3.Table 1:<strong>Participation</strong> Overlap between Diverse Institutions and Larger <strong>Cultural</strong> InstitutionsOverlap Count %Diverse/Also <strong>in</strong> Larger Institutions 23,000 43Diverse/Not <strong>in</strong> Larger Institutions 30,000 57Totals 53,000 100Table 1 shows that more than half (57 percent) of the households that participate <strong>in</strong> theDiverse <strong>in</strong>stitutions <strong>in</strong> our sample do not also participate <strong>in</strong> the larger <strong>in</strong>stitutions; thusthese <strong>in</strong>stitutions are reach<strong>in</strong>g an additional audience. Map 16 shows the distribution ofthis additional audience. It is mostly on the North Side, away from the lakefront, but withsignificant pockets on the South Side that do not appear <strong>in</strong> the density map for the large<strong>in</strong>stitutions.Table 2:<strong>Participation</strong> Overlap between Ethnic Institutions and Larger <strong>Cultural</strong> InstitutionsOverlap Count %Ethnic/Also <strong>in</strong> Larger Institutions 11,000 27Ethnic/Not <strong>in</strong> Larger Institutions 31,000 73Totals 42,000 100Table 2 shows that <strong>in</strong> the case of Ethnic <strong>in</strong>stitutions, the additional audience is aneven greater proportion of the total. About three quarters (73 percent) of their audiencedoes not participate <strong>in</strong> the larger <strong>in</strong>stitutions. Map 17, which displays the density ofparticipation <strong>in</strong> ethnically specific <strong>in</strong>stitutions, is dramatically different from the generalmap of participation density. The concentrations are on the South Side and the southcentral areas, with relatively little density on the North Side, especially along thelakefront.Other smaller <strong>in</strong>stitutions also tap additional audiences; the location of theseaudiences depends on the nature and location of the <strong>in</strong>stitutions.To put these results <strong>in</strong> context, we look at the audiences for the Other arts organizations<strong>in</strong> our sample. Table 3 shows that, as for Ethnic and Diverse <strong>in</strong>stitutions, the majority(<strong>in</strong> this case, 64 percent) of the audience does not participate <strong>in</strong> the larger organizations.Map 18 shows the geographical distribution of this additional audience. The concentrationsare on the North Side, not by the lake, with pockets of high density <strong>in</strong> the Hyde Park andKenwood and Beverly areas on the South Side.46 Ethnic, Diverse, and Other Institutions