Mapping Cultural Participation in Chicago - Cultural Policy Center
Mapping Cultural Participation in Chicago - Cultural Policy Center
Mapping Cultural Participation in Chicago - Cultural Policy Center

You also want an ePaper? Increase the reach of your titles
YUMPU automatically turns print PDFs into web optimized ePapers that Google loves.
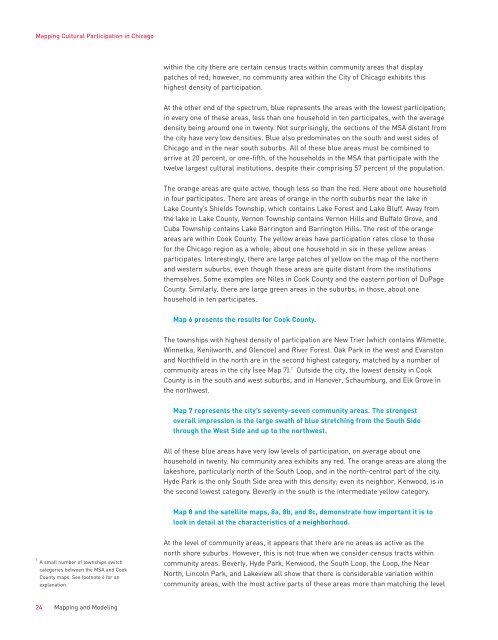
<strong>Mapp<strong>in</strong>g</strong> <strong>Cultural</strong> <strong>Participation</strong> <strong>in</strong> <strong>Chicago</strong>with<strong>in</strong> the city there are certa<strong>in</strong> census tracts with<strong>in</strong> community areas that displaypatches of red; however, no community area with<strong>in</strong> the City of <strong>Chicago</strong> exhibits thishighest density of participation.At the other end of the spectrum, blue represents the areas with the lowest participation;<strong>in</strong> every one of these areas, less than one household <strong>in</strong> ten participates, with the averagedensity be<strong>in</strong>g around one <strong>in</strong> twenty. Not surpris<strong>in</strong>gly, the sections of the MSA distant fromthe city have very low densities. Blue also predom<strong>in</strong>ates on the south and west sides of<strong>Chicago</strong> and <strong>in</strong> the near south suburbs. All of these blue areas must be comb<strong>in</strong>ed toarrive at 20 percent, or one-fifth, of the households <strong>in</strong> the MSA that participate with thetwelve largest cultural <strong>in</strong>stitutions, despite their compris<strong>in</strong>g 57 percent of the population.The orange areas are quite active, though less so than the red. Here about one household<strong>in</strong> four participates. There are areas of orange <strong>in</strong> the north suburbs near the lake <strong>in</strong>Lake County’s Shields Township, which conta<strong>in</strong>s Lake Forest and Lake Bluff. Away fromthe lake <strong>in</strong> Lake County, Vernon Township conta<strong>in</strong>s Vernon Hills and Buffalo Grove, andCuba Township conta<strong>in</strong>s Lake Barr<strong>in</strong>gton and Barr<strong>in</strong>gton Hills. The rest of the orangeareas are with<strong>in</strong> Cook County. The yellow areas have participation rates close to thosefor the <strong>Chicago</strong> region as a whole; about one household <strong>in</strong> six <strong>in</strong> these yellow areasparticipates. Interest<strong>in</strong>gly, there are large patches of yellow on the map of the northernand western suburbs, even though these areas are quite distant from the <strong>in</strong>stitutionsthemselves. Some examples are Niles <strong>in</strong> Cook County and the eastern portion of DuPageCounty. Similarly, there are large green areas <strong>in</strong> the suburbs; <strong>in</strong> those, about onehousehold <strong>in</strong> ten participates.Map 6 presents the results for Cook County.The townships with highest density of participation are New Trier (which conta<strong>in</strong>s Wilmette,W<strong>in</strong>netka, Kenilworth, and Glencoe) and River Forest. Oak Park <strong>in</strong> the west and Evanstonand Northfield <strong>in</strong> the north are <strong>in</strong> the second highest category, matched by a number ofcommunity areas <strong>in</strong> the city (see Map 7). 7 Outside the city, the lowest density <strong>in</strong> CookCounty is <strong>in</strong> the south and west suburbs, and <strong>in</strong> Hanover, Schaumburg, and Elk Grove <strong>in</strong>the northwest.Map 7 represents the city’s seventy-seven community areas. The strongestoverall impression is the large swath of blue stretch<strong>in</strong>g from the South Sidethrough the West Side and up to the northwest.All of these blue areas have very low levels of participation, on average about onehousehold <strong>in</strong> twenty. No community area exhibits any red. The orange areas are along thelakeshore, particularly north of the South Loop, and <strong>in</strong> the north-central part of the city.Hyde Park is the only South Side area with this density; even its neighbor, Kenwood, is <strong>in</strong>the second lowest category. Beverly <strong>in</strong> the south is the <strong>in</strong>termediate yellow category.Map 8 and the satellite maps, 8a, 8b, and 8c, demonstrate how important it is tolook <strong>in</strong> detail at the characteristics of a neighborhood.7 A small number of townships switchcategories between the MSA and CookCounty maps. See footnote 6 for anexplanation.At the level of community areas, it appears that there are no areas as active as thenorth shore suburbs. However, this is not true when we consider census tracts with<strong>in</strong>community areas. Beverly, Hyde Park, Kenwood, the South Loop, the Loop, the NearNorth, L<strong>in</strong>coln Park, and Lakeview all show that there is considerable variation with<strong>in</strong>community areas, with the most active parts of these areas more than match<strong>in</strong>g the level24 <strong>Mapp<strong>in</strong>g</strong> and Model<strong>in</strong>g