Mapping Cultural Participation in Chicago - Cultural Policy Center
Mapping Cultural Participation in Chicago - Cultural Policy Center
Mapping Cultural Participation in Chicago - Cultural Policy Center

Create successful ePaper yourself
Turn your PDF publications into a flip-book with our unique Google optimized e-Paper software.
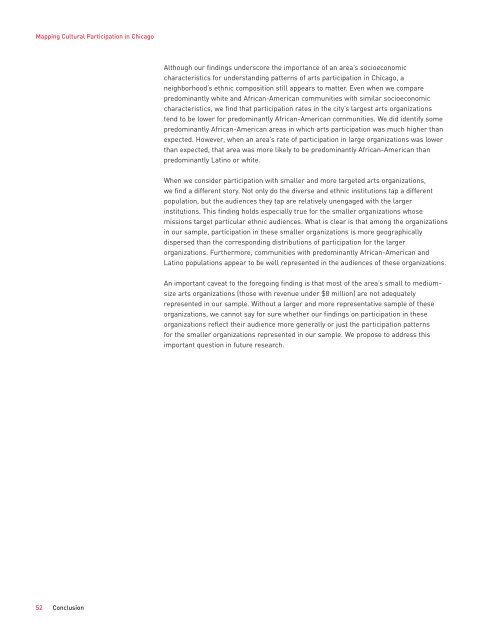
<strong>Mapp<strong>in</strong>g</strong> <strong>Cultural</strong> <strong>Participation</strong> <strong>in</strong> <strong>Chicago</strong>Although our f<strong>in</strong>d<strong>in</strong>gs underscore the importance of an area’s socioeconomiccharacteristics for understand<strong>in</strong>g patterns of arts participation <strong>in</strong> <strong>Chicago</strong>, aneighborhood’s ethnic composition still appears to matter. Even when we comparepredom<strong>in</strong>antly white and African-American communities with similar socioeconomiccharacteristics, we f<strong>in</strong>d that participation rates <strong>in</strong> the city’s largest arts organizationstend to be lower for predom<strong>in</strong>antly African-American communities. We did identify somepredom<strong>in</strong>antly African-American areas <strong>in</strong> which arts participation was much higher thanexpected. However, when an area’s rate of participation <strong>in</strong> large organizations was lowerthan expected, that area was more likely to be predom<strong>in</strong>antly African-American thanpredom<strong>in</strong>antly Lat<strong>in</strong>o or white.When we consider participation with smaller and more targeted arts organizations,we f<strong>in</strong>d a different story. Not only do the diverse and ethnic <strong>in</strong>stitutions tap a differentpopulation, but the audiences they tap are relatively unengaged with the larger<strong>in</strong>stitutions. This f<strong>in</strong>d<strong>in</strong>g holds especially true for the smaller organizations whosemissions target particular ethnic audiences. What is clear is that among the organizations<strong>in</strong> our sample, participation <strong>in</strong> these smaller organizations is more geographicallydispersed than the correspond<strong>in</strong>g distributions of participation for the largerorganizations. Furthermore, communities with predom<strong>in</strong>antly African-American andLat<strong>in</strong>o populations appear to be well represented <strong>in</strong> the audiences of these organizations.An important caveat to the forego<strong>in</strong>g f<strong>in</strong>d<strong>in</strong>g is that most of the area’s small to mediumsizearts organizations (those with revenue under $8 million) are not adequatelyrepresented <strong>in</strong> our sample. Without a larger and more representative sample of theseorganizations, we cannot say for sure whether our f<strong>in</strong>d<strong>in</strong>gs on participation <strong>in</strong> theseorganizations reflect their audience more generally or just the participation patternsfor the smaller organizations represented <strong>in</strong> our sample. We propose to address thisimportant question <strong>in</strong> future research.52 Conclusion