Mapping Cultural Participation in Chicago - Cultural Policy Center
Mapping Cultural Participation in Chicago - Cultural Policy Center
Mapping Cultural Participation in Chicago - Cultural Policy Center

Create successful ePaper yourself
Turn your PDF publications into a flip-book with our unique Google optimized e-Paper software.
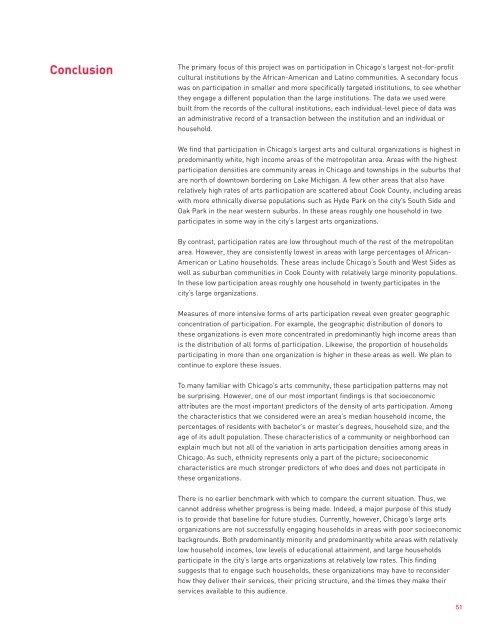
ConclusionThe primary focus of this project was on participation <strong>in</strong> <strong>Chicago</strong>’s largest not-for-profitcultural <strong>in</strong>stitutions by the African-American and Lat<strong>in</strong>o communities. A secondary focuswas on participation <strong>in</strong> smaller and more specifically targeted <strong>in</strong>stitutions, to see whetherthey engage a different population than the large <strong>in</strong>stitutions. The data we used werebuilt from the records of the cultural <strong>in</strong>stitutions; each <strong>in</strong>dividual-level piece of data wasan adm<strong>in</strong>istrative record of a transaction between the <strong>in</strong>stitution and an <strong>in</strong>dividual orhousehold.We f<strong>in</strong>d that participation <strong>in</strong> <strong>Chicago</strong>’s largest arts and cultural organizations is highest <strong>in</strong>predom<strong>in</strong>antly white, high <strong>in</strong>come areas of the metropolitan area. Areas with the highestparticipation densities are community areas <strong>in</strong> <strong>Chicago</strong> and townships <strong>in</strong> the suburbs thatare north of downtown border<strong>in</strong>g on Lake Michigan. A few other areas that also haverelatively high rates of arts participation are scattered about Cook County, <strong>in</strong>clud<strong>in</strong>g areaswith more ethnically diverse populations such as Hyde Park on the city’s South Side andOak Park <strong>in</strong> the near western suburbs. In these areas roughly one household <strong>in</strong> twoparticipates <strong>in</strong> some way <strong>in</strong> the city’s largest arts organizations.By contrast, participation rates are low throughout much of the rest of the metropolitanarea. However, they are consistently lowest <strong>in</strong> areas with large percentages of African-American or Lat<strong>in</strong>o households. These areas <strong>in</strong>clude <strong>Chicago</strong>’s South and West Sides aswell as suburban communities <strong>in</strong> Cook County with relatively large m<strong>in</strong>ority populations.In these low participation areas roughly one household <strong>in</strong> twenty participates <strong>in</strong> thecity’s large organizations.Measures of more <strong>in</strong>tensive forms of arts participation reveal even greater geographicconcentration of participation. For example, the geographic distribution of donors tothese organizations is even more concentrated <strong>in</strong> predom<strong>in</strong>antly high <strong>in</strong>come areas thanis the distribution of all forms of participation. Likewise, the proportion of householdsparticipat<strong>in</strong>g <strong>in</strong> more than one organization is higher <strong>in</strong> these areas as well. We plan tocont<strong>in</strong>ue to explore these issues.To many familiar with <strong>Chicago</strong>’s arts community, these participation patterns may notbe surpris<strong>in</strong>g. However, one of our most important f<strong>in</strong>d<strong>in</strong>gs is that socioeconomicattributes are the most important predictors of the density of arts participation. Amongthe characteristics that we considered were an area’s median household <strong>in</strong>come, thepercentages of residents with bachelor’s or master’s degrees, household size, and theage of its adult population. These characteristics of a community or neighborhood canexpla<strong>in</strong> much but not all of the variation <strong>in</strong> arts participation densities among areas <strong>in</strong><strong>Chicago</strong>. As such, ethnicity represents only a part of the picture; socioeconomiccharacteristics are much stronger predictors of who does and does not participate <strong>in</strong>these organizations.There is no earlier benchmark with which to compare the current situation. Thus, wecannot address whether progress is be<strong>in</strong>g made. Indeed, a major purpose of this studyis to provide that basel<strong>in</strong>e for future studies. Currently, however, <strong>Chicago</strong>’s large artsorganizations are not successfully engag<strong>in</strong>g households <strong>in</strong> areas with poor socioeconomicbackgrounds. Both predom<strong>in</strong>antly m<strong>in</strong>ority and predom<strong>in</strong>antly white areas with relativelylow household <strong>in</strong>comes, low levels of educational atta<strong>in</strong>ment, and large householdsparticipate <strong>in</strong> the city’s large arts organizations at relatively low rates. This f<strong>in</strong>d<strong>in</strong>gsuggests that to engage such households, these organizations may have to reconsiderhow they deliver their services, their pric<strong>in</strong>g structure, and the times they make theirservices available to this audience.51