to view the WARR Strategy. - Liverpool City Council - NSW ...
to view the WARR Strategy. - Liverpool City Council - NSW ...
to view the WARR Strategy. - Liverpool City Council - NSW ...

Create successful ePaper yourself
Turn your PDF publications into a flip-book with our unique Google optimized e-Paper software.
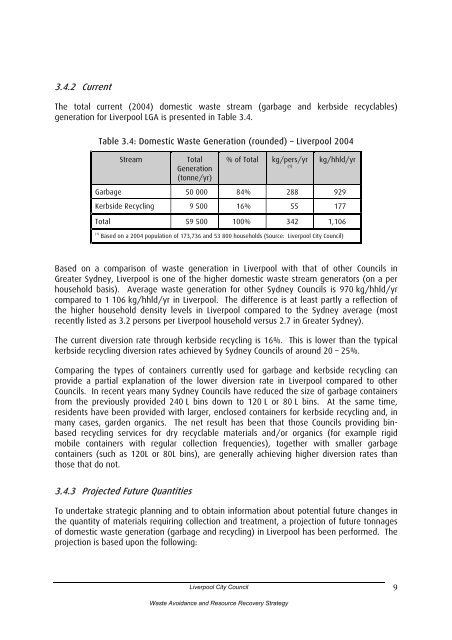
3.4.2 CurrentThe <strong>to</strong>tal current (2004) domestic waste stream (garbage and kerbside recyclables)generation for <strong>Liverpool</strong> LGA is presented in Table 3.4.Table 3.4: Domestic Waste Generation (rounded) – <strong>Liverpool</strong> 2004StreamTotalGeneration(<strong>to</strong>nne/yr)% of Total kg/pers/yr(1)kg/hhld/yrGarbage 50 000 84% 288 929Kerbside Recycling 9 500 16% 55 177Total 59 500 100% 342 1,106(1)Based on a 2004 population of 173,736 and 53 800 households (Source: <strong>Liverpool</strong> <strong>City</strong> <strong>Council</strong>)Based on a comparison of waste generation in <strong>Liverpool</strong> with that of o<strong>the</strong>r <strong>Council</strong>s inGreater Sydney, <strong>Liverpool</strong> is one of <strong>the</strong> higher domestic waste stream genera<strong>to</strong>rs (on a perhousehold basis). Average waste generation for o<strong>the</strong>r Sydney <strong>Council</strong>s is 970 kg/hhld/yrcompared <strong>to</strong> 1 106 kg/hhld/yr in <strong>Liverpool</strong>. The difference is at least partly a reflection of<strong>the</strong> higher household density levels in <strong>Liverpool</strong> compared <strong>to</strong> <strong>the</strong> Sydney average (mostrecently listed as 3.2 persons per <strong>Liverpool</strong> household versus 2.7 in Greater Sydney).The current diversion rate through kerbside recycling is 16%. This is lower than <strong>the</strong> typicalkerbside recycling diversion rates achieved by Sydney <strong>Council</strong>s of around 20 – 25%.Comparing <strong>the</strong> types of containers currently used for garbage and kerbside recycling canprovide a partial explanation of <strong>the</strong> lower diversion rate in <strong>Liverpool</strong> compared <strong>to</strong> o<strong>the</strong>r<strong>Council</strong>s. In recent years many Sydney <strong>Council</strong>s have reduced <strong>the</strong> size of garbage containersfrom <strong>the</strong> previously provided 240 L bins down <strong>to</strong> 120 L or 80 L bins. At <strong>the</strong> same time,residents have been provided with larger, enclosed containers for kerbside recycling and, inmany cases, garden organics. The net result has been that those <strong>Council</strong>s providing binbasedrecycling services for dry recyclable materials and/or organics (for example rigidmobile containers with regular collection frequencies), <strong>to</strong>ge<strong>the</strong>r with smaller garbagecontainers (such as 120L or 80L bins), are generally achieving higher diversion rates thanthose that do not.3.4.3 Projected Future QuantitiesTo undertake strategic planning and <strong>to</strong> obtain information about potential future changes in<strong>the</strong> quantity of materials requiring collection and treatment, a projection of future <strong>to</strong>nnagesof domestic waste generation (garbage and recycling) in <strong>Liverpool</strong> has been performed. Theprojection is based upon <strong>the</strong> following:<strong>Liverpool</strong> <strong>City</strong> <strong>Council</strong>9Waste Avoidance and Resource Recovery <strong>Strategy</strong>