Table 3.5: Estimated Proportion of Total Domestic Waste Generationwithin <strong>Liverpool</strong> LGAZone Suburbs Proportion of Total Waste1998 2001 2011North EastSouth EastWestGreen Valley, Busby, Hinchinbrook,Miller, Cartwright, <strong>Liverpool</strong>, Ashcroft,Lurnea, Heckenberg, Warwick Farm,Chipping Nor<strong>to</strong>n, Moorebank,Hammondville, Voyager Point,Pleasure PointWest Hox<strong>to</strong>n, Horningsea Park,Hox<strong>to</strong>n Park, Pres<strong>to</strong>ns, Casula,Lepping<strong>to</strong>n, Denham Court,Edmondson Park, Ingleburn,Wattle Grove, HolsworthyGreendale, Wallacia, Luddenham,Badgery’s Creek, Bringelly,Kemps Creek, Rossmore, Austral,Cecil Park, Cecil Hills74% 70% 59%15% 19% 32%11% 11% 9%Total 100% 100% 100%The results demonstrate that, with <strong>the</strong> release of urban areas <strong>to</strong> <strong>the</strong> sou<strong>the</strong>ast, a significantlyhigher proportion of <strong>Liverpool</strong>’s domestic waste will be generated from this area (from <strong>the</strong>current 19% <strong>to</strong> 32% of <strong>to</strong>tal domestic waste). This is likely <strong>to</strong> have considerable impacts onwaste transportation logistics.Apart from population changes, future changes in <strong>the</strong> waste generation (not reflected in <strong>the</strong>above projections) may occur due <strong>to</strong> changes in demographics (such as income) and ingovernment policy, as well as industry initiatives and developments (for example, packagingindustry developments, Extended Producer Responsibility programs).3.5 Waste CompositionDuring July and August 2003 a series of waste audits were performed on <strong>the</strong> domesticgarbage and recycling streams (McGregor Environmental Services; 2003). Previous <strong>to</strong> this,<strong>the</strong> most recent audit was conducted in 1999. Presented in Figure 3.3 is <strong>the</strong> compositionalassessment of <strong>the</strong> domestic garbage stream.For ease of interpretation, <strong>the</strong> categories have been summarised <strong>to</strong>ge<strong>the</strong>r with a weightingbased upon <strong>the</strong> split of single unit dwellings (84% of <strong>to</strong>tal dwellings) and multi-unitdwellings (16%), which were separately audited.<strong>Liverpool</strong> <strong>City</strong> <strong>Council</strong>11Waste Avoidance and Resource Recovery <strong>Strategy</strong>
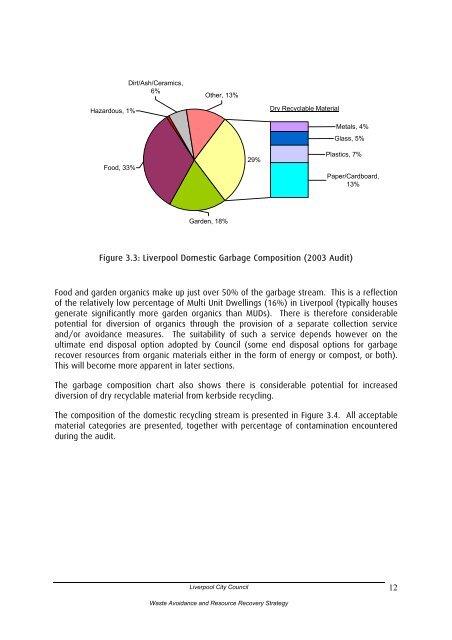
Dirt/Ash/Ceramics,6%O<strong>the</strong>r, 13%Hazardous, 1%Dry Recyclable MaterialFood, 33%29%Metals, 4%Glass, 5%Plastics, 7%Paper/Cardboard,13%Garden, 18%Figure 3.3: <strong>Liverpool</strong> Domestic Garbage Composition (2003 Audit)Food and garden organics make up just over 50% of <strong>the</strong> garbage stream. This is a reflectionof <strong>the</strong> relatively low percentage of Multi Unit Dwellings (16%) in <strong>Liverpool</strong> (typically housesgenerate significantly more garden organics than MUDs). There is <strong>the</strong>refore considerablepotential for diversion of organics through <strong>the</strong> provision of a separate collection serviceand/or avoidance measures. The suitability of such a service depends however on <strong>the</strong>ultimate end disposal option adopted by <strong>Council</strong> (some end disposal options for garbagerecover resources from organic materials ei<strong>the</strong>r in <strong>the</strong> form of energy or compost, or both).This will become more apparent in later sections.The garbage composition chart also shows <strong>the</strong>re is considerable potential for increaseddiversion of dry recyclable material from kerbside recycling.The composition of <strong>the</strong> domestic recycling stream is presented in Figure 3.4. All acceptablematerial categories are presented, <strong>to</strong>ge<strong>the</strong>r with percentage of contamination encounteredduring <strong>the</strong> audit.<strong>Liverpool</strong> <strong>City</strong> <strong>Council</strong>12Waste Avoidance and Resource Recovery <strong>Strategy</strong>