Untitled - Domain-b
Untitled - Domain-b
Untitled - Domain-b
- No tags were found...

You also want an ePaper? Increase the reach of your titles
YUMPU automatically turns print PDFs into web optimized ePapers that Google loves.
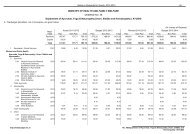
Authorized Share Capital consists of 750,000,000 equity sharesof Rs 2 each. During the year, employees exercised 2355096,3688408 and 2480108 equity shares under the employees stockoptions plan 1999, 2000 & 2004 respectively. Consequentlyissued, subscribed and paid capital increased by 8,527,212equity shares and share capital increased by Rs 1.71 crores.Reserves:-Debenture Redemption Reserve:-During the year company has raised Rs 1000 crores throughsecured redeemable non convertible debentures of Rs 10lacs each which is redeemable in tranches of 2, 3 & 5 years.As per Section 117C of the Companies Act 1956, Companyis required to create debenture redemption reserve to whichadequate amounts should be credited from out of its protsuntil such debentures are redeemed. Accordingly Companyhas apportioned Rs 295 crores out of its current year protstowards debenture redemption reserve.Borrowings:-Company has outstanding borrowings of Rs. 2,724.2 crores asof June 30 2010 primarily consisting of the following:-• Secured redeemable non convertible debentures of Rs10 lacs each issued for Rs. 1000 Crores redeemable intranches of 2, 3 & 5 years and have an interest cost varyingbetween 7.55% to 8.80%.• Secured long term foreign currency loan of Rs. 1212.1 crores(USD Equivalent 261.0 Mn) crores from banks repayablewithin a period eight half yearly equal installments startingfrom May 2011 carrying interest ranging from 3% to 4%.Fixed Assets:-The Company has made additions of Rs. 678.8 crores during2010 in the gross block of xed assets which comprisescomputers, software, other equipments and investment infacilities. Additions include Rs. 105.6 crores being assets(including goodwill) acquired on consummation of acquisitionduring the year. Gross block of xed assets as at the end of scal2010 stood at Rs. 7061.6 crores and capital work in progress(including capital advances) stood at Rs. 609.1 crores.The Company is in the process of developing facilities in itscampuses at NOIDA, Chennai, Bangalore and Manesar. Thesecampuses are spread over a combined area of 121 acres. 8400seats have already become operational at these campuses and16,000 seats are under development at these campuses. Allthe campuses excluding Manesar are approved SEZ locations.Expenditure incurred till end of scal 2010 for the facilities underconstruction is appearing under capital work in progress.Treasury Investments:-The guiding principle of the Company’s treasury investment isSafety, liquidity & Return. The Company has efciently managedits surplus funds through careful treasury operations.The Company deploys its surplus funds primarily in debt mutualfunds and bank xed deposits with a limit on investments withindividual fund/bank. As at the end of scal 2010, almost entiresurplus funds are invested in xed deposit with nationalizedbanks.(Rs in Crores)Particulars 2010 2009Debt Mutual Funds 782.1 20.0Bonds 50.0 20.0Fixed Deposits with Banks 1,099.2 1,494.6Inter corporate deposits with HDFC Limited 100.0 -Total 2,031.3 1,534.6CASH FLOWSCash Flows from Operating Activities:-Cash generated from operations provides the major sourceof funds for the growth of the business. Net cash provided byoperating activities was Rs. 1,791.2 crores and Rs. 1,117.8 croresin scal 2010 and 2009 respectively.Cash Flows from Investing Activities:-In scal 2010, an amount of Rs. 646.8 crores was invested inxed assets. Rs.50.8 crores were used for payment for businessacquisitions.Cash Flows from Financing Activities:-Cash ow from nancing activities in the year under reviewhad an outow of Rs. 727.8 crores against inow of Rs 2,249.9crores in 2009. This is mainly because of repayment of shortterm foreign currency loan of Rs 2395.0 crores (USD 585Mn)and Rs 315.2 crores pertaining to the nal dividend declaredin the previous scal year as well as the interim dividends paidduring the year.HCL Technologies Limited (Standalone):-The Consolidated Financial Statements brings outcomprehensively the performance of the Company andare more relevant for understanding the Company’sPerformance.The discussion in the paragraph 1 which follows should be readin conjunction with the nancial statements and related notesrelevant to HCLT Limited (Standalone) for the year ended 30June ‘2010.RESULTS OF OPERATIONS (STANDALONE)(Rs. in Crores)For the Year EndedJune 30, 2010For the Year EndedJune 30, 2009Growth% of% of %ParticularsAmount Revenue Amount Revenue IncreaseRevenue 5,078.8 100.0% 4,675.1 100.0% 8.6%Total Revenue 5,078.8 100.0% 4,675.1 100.0% 8.6%Cost of Goods Sold 85.5 1.7% - - -Personnel Expenses 2,187.7 43.1% 1,930.2 41.3% 13.3%Operating and other1,449.2 28.5% 1,539.0 32.9% -5.8%expensesDepreciation 274.0 5.4% 251.9 5.4% 8.8%Total Expenditure 3,996.4 78.7% 3,721.1 79.6% 7.4%Prot before Interest, 1,082.4 21.3% 954.0 20.4% 13.5%Other Income & TaxInterest 101.4 2.0% 28.1 0.6% 260.9%Other Income 171.8 3.4% 265.8 5.4% -35.4%Prot before Tax 1,152.8 22.7% 1,191.7 25.5% -3.3%Provision for tax 96.2 1.9% 194.4 4.2% -50.5%Prot after tax 1,056.6 20.8% 997.3 21.3% 5.9%13