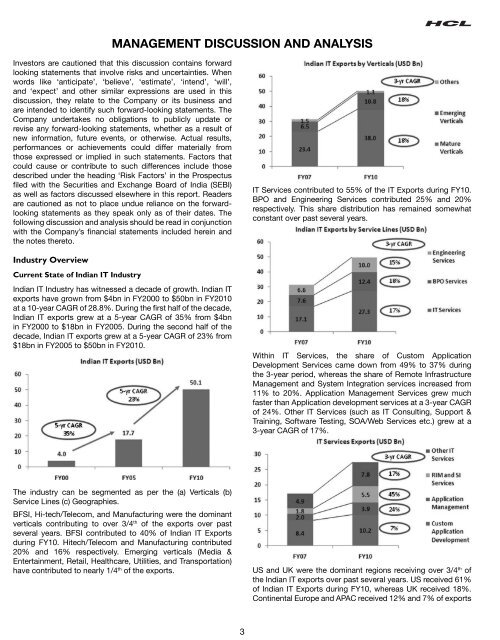
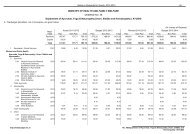
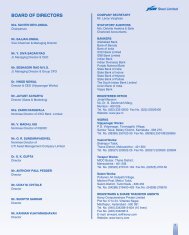
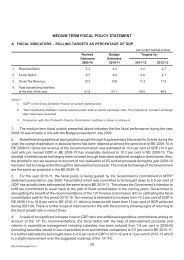
MANAGEMENT DISCUSSION AND ANALYSISInvestors are cautioned that this discussion contains forwardlooking statements that involve risks and uncertainties. Whenwords like ‘anticipate’, ‘believe’, ‘estimate’, ‘intend’, ‘will’,and ‘expect’ and other similar expressions are used in thisdiscussion, they relate to the Company or its business andare intended to identify such forward-looking statements. TheCompany undertakes no obligations to publicly update orrevise any forward-looking statements, whether as a result ofnew information, future events, or otherwise. Actual results,performances or achievements could differ materially fromthose expressed or implied in such statements. Factors thatcould cause or contribute to such differences include thosedescribed under the heading ‘Risk Factors’ in the Prospectusled with the Securities and Exchange Board of India (SEBI)as well as factors discussed elsewhere in this report. Readersare cautioned as not to place undue reliance on the forwardlookingstatements as they speak only as of their dates. Thefollowing discussion and analysis should be read in conjunctionwith the Company’s nancial statements included herein andthe notes thereto.Industry OverviewCurrent State of Indian IT IndustryIndian IT Industry has witnessed a decade of growth. Indian ITexports have grown from $4bn in FY2000 to $50bn in FY2010at a 10-year CAGR of 28.8%. During the rst half of the decade,Indian IT exports grew at a 5-year CAGR of 35% from $4bnin FY2000 to $18bn in FY2005. During the second half of thedecade, Indian IT exports grew at a 5-year CAGR of 23% from$18bn in FY2005 to $50bn in FY2010.IT Services contributed to 55% of the IT Exports during FY10.BPO and Engineering Services contributed 25% and 20%respectively. This share distribution has remained somewhatconstant over past several years.Within IT Services, the share of Custom ApplicationDevelopment Services came down from 49% to 37% duringthe 3-year period, whereas the share of Remote InfrastructureManagement and System Integration services increased from11% to 20%. Application Management Services grew muchfaster than Application development services at a 3-year CAGRof 24%. Other IT Services (such as IT Consulting, Support &Training, Software Testing, SOA/Web Services etc.) grew at a3-year CAGR of 17%.The industry can be segmented as per the (a) Verticals (b)Service Lines (c) Geographies.BFSI, Hi-tech/Telecom, and Manufacturing were the dominantverticals contributing to over 3/4 th of the exports over pastseveral years. BFSI contributed to 40% of Indian IT Exportsduring FY10. Hitech/Telecom and Manufacturing contributed20% and 16% respectively. Emerging verticals (Media &Entertainment, Retail, Healthcare, Utilities, and Transportation)have contributed to nearly 1/4 th of the exports.US and UK were the dominant regions receiving over 3/4 th ofthe Indian IT exports over past several years. US received 61%of Indian IT Exports during FY10, whereas UK received 18%.Continental Europe and APAC received 12% and 7% of exports3
espectively. The Geo distribution has not changed much overpast several years.– particular into large accounts – will be critical for the company’sgrowth in the coming years.Figure: Opportunities for GrowthExisting customersCross-sell Up-sell NewPropositionsNew customersHCL has grown faster than Indian IT Industry during the lastdecade. While HCL growth was lagging behind Indian ITIndustry growth during the rst half of the decade, HCL cameback strongly during the second half of the decade. During therst half of the decade, HCL revenues grew at a 5-year CAGRof 30% from $207mn in FY2000 to $764mn in FY2005. Duringthe second half of the decade, HCL revenues grew at a 5-yearCAGR of 29% from $764mn in FY2005 to $2705mn in FY2010.Overall, HCL revenues grew at a 10-year CAGR of 29.3%.Drivers for Future GrowthWhile Indian IT exports grew at a 10-yr CAGR of 29% duringthe last decade, Global IT services spending grew at a 10-yrCAGR in lower single digits during the same period. This is astory of ‘market-share gains’ or ‘replacement revenue’. At thestart of the last decade, in the year 2000, Top Indian 5 IT playersMarket Share in the Global IT Services spending was just about0.1%. By the end of the decade, in the year 2009, their Marketshare increased to about 2.4%. There is still big headroom forgrowth for Indian IT Industry.According to a customer satisfaction (CSAT) survey of HCLcustomers in 2009, cost reduction was considered to bethe most important business priority across all the verticalsand geographies. With continued cost pressures across thebusinesses and India’s still attractive 30-40% cost advantage,the next level of replacement revenue is about to begin.Growth opportunities for HCL can come from existingcustomers as well as new customers. From existing customers,opportunities are in cross-sell, up-sell, and new propositionssuch as business-aligned IT, cloud computing, platform-basedBPO, and green IT. HCL’s ability to grow customer relationshipsVendorconsolidationNewverticalsNewgeosNewPropositionsGrowth opportunities from new customers can come fromVendor consolidation, New Verticals, New Geographies, and NewPropositions. Vendor consolidation means reducing the number ofvendor engagements to an efcient “core” capable of providing allneeded services, software, systems, and partnering relationships.It offers the following business benets to customers: reducedtotal cost of ownership (TCO), streamlined vendor relationshipmanagement, reduced number of support contracts to negotiateand manage, increased procurement process leverage, andreduced training, certication, and administration expenses. Thetrend of vendor consolidation will contribute signicantly to greateroffshore content in global IT services.For growth opportunities from new customers, the NASSCOM-McKinsey 2020 report provides useful inputs. Published in April2009, the NASSCOM-McKinsey 2020 report is the third reportpublished by NASSCOM and McKinsey on the future of IT Industry.The report discusses seven Global Megatrends that will drive theincrease in global sourcing and domestic outsourcing addressablemarket opportunity from $500 bn to $1.5 trn by 2020.The NASSCOM-Mckinsey 2020 report examines the totaladdressable global sourcing market along four dimensions:1. Core Market Opportunities: The total addressable marketfor core markets (large enterprises in developed countriesin verticals such as telecom, banking, insurance, andmanufacturing) was $500 bn in 2008. It is expected toreach $700 bn by 2020.2. New Verticals: Over the next 12 years, several emergingverticals will become the next major segments after thecore verticals. The four emerging verticals are: Public sector& defense, Healthcare Providers, Utilities, and Media.The addressable market for these emerging verticals isexpected to reach $190 bn by 2020.3. New Geographies: BRIC countries will offer a domesticoutsourcing market of $380 bn by 2020.4. New Customer segments: The global sourcingaddressable market for SMBs in core geographies is likelyto be around $230 bn in 2020.While core markets will present an additional $200 bnaddressable market by 2020, new verticals and new geographieswill present a $580 bn addressable market by 2020—three timesthe additional opportunity presented by core verticals.4