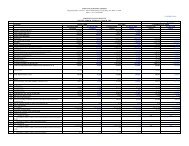
shares of face value of Rs. 2/- each, for approval of theshareholders at the Annual General Meeting. Together with the3 interim dividends of Re. 1 per share each time on equityshares of face value of Rs. 2/- each, the total dividend for theyear works out to Rs. 4/-. The nal dividend, if approved by theshareholders, will be paid on or before November 27, 2010.Dates of transfer of Unclaimed Dividend to Investor Educationand Protection Fund (IEPF)Pursuant to section 205A of the Companies Act, 1956,unclaimed balance of the dividends lying in the dividendaccounts till April, 2003 have been transferred to the InvestorEducation and Protection Fund (IEPF) established by theCentral Government. The dividends for the following years,which remain unclaimed for seven years, will be transferredto the IEPF in accordance with the schedule given below.Shareholders who have not encashed their dividend warrantsrelating to the dividend specied in table below are requestedto immediately send their request for issue of duplicatewarrants. Once unclaimed dividend is transferred to the IEPF,no claim shall lie in respect thereof either with the Companyor IEPF.Financial Year Type of Dividend Date of Declaration Due Date for transfer to IEPF2002-03 Final December 20, 2003 January 19, 20111 st Interim October 31, 2003 November 30, 20102003-042 nd Interim January 29, 2004 February 28, 20113 rd Interim April 26, 2004 May 26, 2011Final December 17, 2004 January 16, 20121 st Interim October 25, 2004 November 24, 20112004-052 nd Interim January 25, 2005 February 24, 20123 rd Interim April 25, 2005 May 25, 2012Final December 16, 2005 January 15, 20131 st Interim October 25, 2005 November 24, 20122005-062 nd Interim January 18, 2006 February 17, 20133 rd Interim April 19, 2006 May 19, 2013Final December 14, 2006 January 13, 20141 st Interim October 16, 2006 November 15, 20132006-072 nd Interim January 15, 2007 February 14, 20143 rd Interim April 17, 2007 May 17, 2014Final December 13, 2007 January 12, 20151 st Interim October 16, 2007 November 15, 20142007-082 nd Interim January 17, 2008 February 16, 20153 rd Interim April 15, 2008 May 15, 2015Final October 22, 2008 November 21, 20151 st Interim October 15, 2008 November 14, 20152008-092 nd Interim January 23, 2009 February 22, 20163 rd Interim April 22, 2009 May 22, 2016Final December 08, 2009 January 07, 20171 st Interim October 28, 2009 November 27, 20162009-102 nd Interim January 25, 2010 February 24, 20173 rd Interim April 21, 2010 May 21, 2017e) Distribution of shareholding as on June 30, 2010Number of EquityShares heldNo. ofShareholders49Shareholders(%)No. ofSharesShares(%)1 – 100 59,382 74.88 2,117,155 0.31101 – 200 9,479 11.95 1,676,705 0.25201 – 500 4,882 6.16 1,715,246 0.25501 – 1000 1,770 2.23 1,353,983 0.201001 – 5000 2,435 3.07 5,947,423 0.885001 – 10000 576 0.73 4,127,889 0.6110001 and above 774 0.98 661,845,411 97.50Total 79,298 100.00 670,256,600 100.00
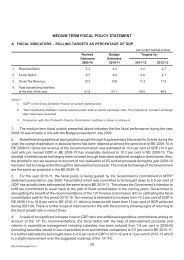
f) Categories of shareholders as on June 30, 2010Category Number of shares held Voting Strength (%)Promoters 443,356,864 65.32Mutual Funds/ UTI 19,358,047 2.85Financial Institutions/ Banks 446,254 0.07Insurance Companies 15,784,045 2.33Foreign Institutional Investors 144,355,150 21.27Foreign Banks 1,244 0.00Bodies Corporate 19,911,475 2.93Individuals 23,001,210 3.39NRIs / OCBs 11,096,534 1.63Foreign Nationals 229,088 0.03Trusts 35,783 0.01HUF 180,644 0.03Clearing Members 1,027,474 0.15Grand Total 678,783,812 100.00g) Stock market dataMonthly high and low quotations, as well as the volume of shares traded at the National Stock Exchange of India Limited (“NSE”)and the Bombay Stock Exchange Limited (“BSE”), for scal year are as follows:Month NSE BSEHigh(Rs.)Low(Rs.)Volume(Number)High(Rs.)Low(Rs.)Volume(Number)July 2009 257.00 162.25 29,209,769 257.00 163.50 4,354,410August 2009 319.90 239.10 41,866,187 315.40 240.00 7,137,306September 2009 352.20 290.00 28,966,318 350.50 290.00 5,540,279October 2009 345.80 290.05 27,036,892 347.00 294.15 4,100,862November 2009 355.95 275.00 21,656,671 350.00 276.50 3,488,735December 2009 388.00 323.30 25,727,432 377.45 327.90 4,552,885January 2010 388.90 318.90 28,868,801 388.00 318.30 3,916,804February 2010 371.75 317.55 16,259,060 371.70 324.50 1,597,174March 2010 385.00 351.30 12,747,306 383.25 350.10 1,214,319April 2010 398.00 340.00 29,755,296 398.55 338.00 3,690,327May 2010 410.00 349.10 18,231,118 448.80 349.50 2,225,480June 2010 398.00 353.00 23,161,325 396.75 347.00 32,143,499h) LiquidityThe Company’s shares are among the most liquid and actively traded shares on NSE and BSE. The monthly trading volumes ofthe Company’s shares on these exchanges are given in the table above in the Paragraph (g) titled `Stock Market Data’.i) Share price performance in comparison to broad based IndicesShare Price Performance during the Year (2009-10) HCL TECH SENSEXShare Price Performance during the Year (2009-10)HCL TECHNIFTY450.0018,000.00450.007000.00400.00400.0017,000.006500.00350.00350.00Price- HCLTECHShare300.00250.00200.00150.0016,000.0015,000.0014,000.00SENSEXShare Price- HCLT TECH300.00250.00200.00150.006000.005500.005000.00NIFT TY100.0050.0013,000.00100.0050.004500.000.00Jul-09Aug-09Sep-09Oct-09Nov-09Dec-09DateJan-10Feb-10Mar-10Apr-10May-10Jun-1012,000.000.00Jul-09Aug-09Sep-09Oct-09Nov-09Dec-09Jan-10DateFeb-10Mar-10Apr-10May-10Jun-104000.0050