Abstracts of the Academy of Dental Materials Annual ... - IsiRed
Abstracts of the Academy of Dental Materials Annual ... - IsiRed
Abstracts of the Academy of Dental Materials Annual ... - IsiRed

Create successful ePaper yourself
Turn your PDF publications into a flip-book with our unique Google optimized e-Paper software.
e28 dental materials 26S (2010) e1–e84<br />
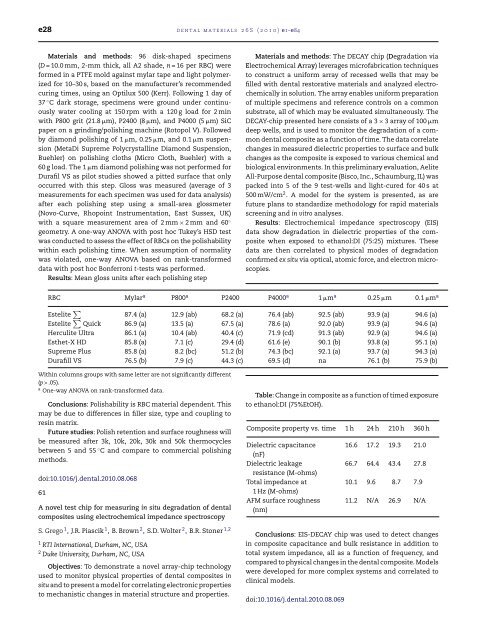
<strong>Materials</strong> and methods: 96 disk-shaped specimens<br />
(D = 10.0 mm, 2-mm thick, all A2 shade, n = 16 per RBC) were<br />
formed in a PTFE mold against mylar tape and light polymerized<br />
for 10–30 s, based on <strong>the</strong> manufacturer’s recommended<br />
curing times, using an Optilux 500 (Kerr). Following 1 day <strong>of</strong><br />
37 ◦ C dark storage, specimens were ground under continuously<br />
water cooling at 150 rpm with a 120 g load for 2 min<br />
with P800 grit (21.8 �m), P2400 (8 �m), and P4000 (5 �m) SiC<br />
paper on a grinding/polishing machine (Rotopol V). Followed<br />
by diamond polishing <strong>of</strong> 1 �m, 0.25 �m, and 0.1 �m suspension<br />
(MetaDi Supreme Polycrystalline Diamond Suspension,<br />
Buehler) on polishing cloths (Micro Cloth, Buehler) with a<br />
60 g load. The 1 �m diamond polishing was not performed for<br />
Durafil VS as pilot studies showed a pitted surface that only<br />
occurred with this step. Gloss was measured (average <strong>of</strong> 3<br />
measurements for each specimen was used for data analysis)<br />
after each polishing step using a small-area glossmeter<br />
(Novo-Curve, Rhopoint Instrumentation, East Sussex, UK)<br />
with a square measurement area <strong>of</strong> 2 mm × 2 mm and 60 ◦<br />
geometry. A one-way ANOVA with post hoc Tukey’s HSD test<br />
was conducted to assess <strong>the</strong> effect <strong>of</strong> RBCs on <strong>the</strong> polishability<br />
within each polishing time. When assumption <strong>of</strong> normality<br />
was violated, one-way ANOVA based on rank-transformed<br />
data with post hoc Bonferroni t-tests was performed.<br />
Results: Mean gloss units after each polishing step<br />
RBC Mylara P800a P2400 P4000a 1 �ma 0.25 �m 0.1 �ma Estelite �<br />
Estelite<br />
87.4 (a) 12.9 (ab) 68.2 (a) 76.4 (ab) 92.5 (ab) 93.9 (a) 94.6 (a)<br />
� Quick 86.9 (a) 13.5 (a) 67.5 (a) 78.6 (a) 92.0 (ab) 93.9 (a) 94.6 (a)<br />
Herculite Ultra 86.1 (a) 10.4 (ab) 40.4 (c) 71.9 (cd) 91.3 (ab) 92.9 (a) 94.6 (a)<br />
Es<strong>the</strong>t-X HD 85.8 (a) 7.1 (c) 29.4 (d) 61.6 (e) 90.1 (b) 93.8 (a) 95.1 (a)<br />
Supreme Plus 85.8 (a) 8.2 (bc) 51.2 (b) 74.3 (bc) 92.1 (a) 93.7 (a) 94.3 (a)<br />
Durafill VS 76.5 (b) 7.9 (c) 44.3 (c) 69.5 (d) na 76.1 (b) 75.9 (b)<br />
Within columns groups with same letter are not significantly different<br />
(p > .05).<br />
a One-way ANOVA on rank-transformed data.<br />
Conclusions: Polishability is RBC material dependent. This<br />
may be due to differences in filler size, type and coupling to<br />
resin matrix.<br />
Future studies: Polish retention and surface roughness will<br />
be measured after 3k, 10k, 20k, 30k and 50k <strong>the</strong>rmocycles<br />
between 5 and 55 ◦ C and compare to commercial polishing<br />
methods.<br />
doi:10.1016/j.dental.2010.08.068<br />
61<br />
A novel test chip for measuring in situ degradation <strong>of</strong> dental<br />
composites using electrochemical impedance spectroscopy<br />
S. Grego 1 , J.R. Piascik 1 ,B.Brown 2 , S.D. Wolter 2 , B.R. Stoner 1,2<br />
1 RTI International, Durham, NC, USA<br />
2 Duke University, Durham, NC, USA<br />
Objectives: To demonstrate a novel array-chip technology<br />
used to monitor physical properties <strong>of</strong> dental composites in<br />
situ and to present a model for correlating electronic properties<br />
to mechanistic changes in material structure and properties.<br />
<strong>Materials</strong> and methods: The DECAY chip (Degradation via<br />
Electrochemical Array) leverages micr<strong>of</strong>abrication techniques<br />
to construct a uniform array <strong>of</strong> recessed wells that may be<br />
filled with dental restorative materials and analyzed electrochemically<br />
in solution. The array enables uniform preparation<br />
<strong>of</strong> multiple specimens and reference controls on a common<br />
substrate, all <strong>of</strong> which may be evaluated simultaneously. The<br />
DECAY-chip presented here consists <strong>of</strong> a 3 × 3 array <strong>of</strong> 100 �m<br />
deep wells, and is used to monitor <strong>the</strong> degradation <strong>of</strong> a common<br />
dental composite as a function <strong>of</strong> time. The data correlate<br />
changes in measured dielectric properties to surface and bulk<br />
changes as <strong>the</strong> composite is exposed to various chemical and<br />
biological environments. In this preliminary evaluation, Aelite<br />
All-Purpose dental composite (Bisco, Inc., Schaumburg, IL) was<br />
packed into 5 <strong>of</strong> <strong>the</strong> 9 test-wells and light-cured for 40 s at<br />
500 mW/cm 2 . A model for <strong>the</strong> system is presented, as are<br />
future plans to standardize methodology for rapid materials<br />
screening and in vitro analyses.<br />
Results: Electrochemical impedance spectroscopy (EIS)<br />
data show degradation in dielectric properties <strong>of</strong> <strong>the</strong> composite<br />
when exposed to ethanol:DI (75:25) mixtures. These<br />
data are <strong>the</strong>n correlated to physical modes <strong>of</strong> degradation<br />
confirmed ex situ via optical, atomic force, and electron microscopies.<br />
Table: Change in composite as a function <strong>of</strong> timed exposure<br />
to ethanol:DI (75%EtOH).<br />
Composite property vs. time 1 h 24 h 210 h 360 h<br />
Dielectric capacitance<br />
(nF)<br />
Dielectric leakage<br />
resistance (M-ohms)<br />
Total impedance at<br />
1 Hz (M-ohms)<br />
AFM surface roughness<br />
(nm)<br />
16.6 17.2 19.3 21.0<br />
66.7 64.4 43.4 27.8<br />
10.1 9.6 8.7 7.9<br />
11.2 N/A 26.9 N/A<br />
Conclusions: EIS-DECAY chip was used to detect changes<br />
in composite capacitance and bulk resistance in addition to<br />
total system impedance, all as a function <strong>of</strong> frequency, and<br />
compared to physical changes in <strong>the</strong> dental composite. Models<br />
were developed for more complex systems and correlated to<br />
clinical models.<br />
doi:10.1016/j.dental.2010.08.069