Making Migration Work - Wetenschappelijke Raad voor het ...
Making Migration Work - Wetenschappelijke Raad voor het ...
Making Migration Work - Wetenschappelijke Raad voor het ...
- No tags were found...

Create successful ePaper yourself
Turn your PDF publications into a flip-book with our unique Google optimized e-Paper software.
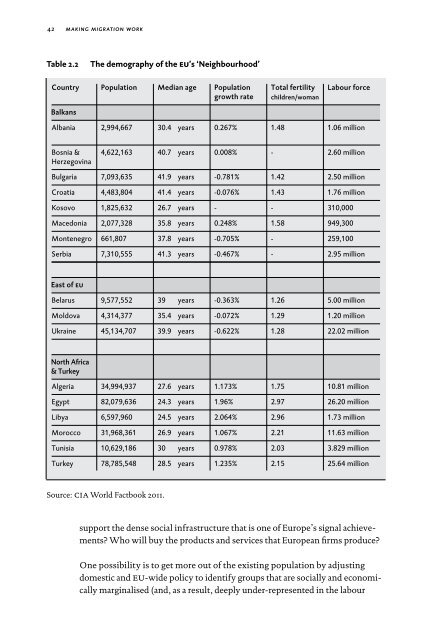
42making migration workTable 2.2The demography of the eu’s ‘Neighbourhood’CountryPopulationMedian agePopulationgrowth rateTotal fertilitychildren/womanLabour forceBalkansAlbania 2,994,667 30.4 years0.267% 1.48 1.06 millionBosnia &Herzegovina4,622,16340.7years0.008% - 2.60 millionBulgaria 7,093,635 41.9Croatia 4,483,804 41.4Kosovo 1,825,632 26.7Macedonia 2,077,328 35.8Montenegro 661,80737.8Serbia 7,310,555 41.3yearsyearsyearsyearsyearsyears-0.781% 1.42 2.50 million-0.076% 1.43 1.76 million- - 310,0000.248% 1.58 949,300-0.705% - 259,100-0.467% - 2.95 millionEast of euBelarus 9,577,552 39Moldova 4,314,377 35.4Ukraine 45,134,707 39.9yearsyearsyears-0.363% 1.26 5.00 million-0.072% 1.29 1.20 million-0.622% 1.28 22.02 millionNorth Africa& TurkeyAlgeria 34,994,937 27.6Egypt 82,079,636 24.3Libya 6,597,960 24.5Morocco 31,968,361 26.9Tunisia 10,629,186 30Turkey 78,785,548 28.5yearsyearsyearsyearsyearsyears1.173% 1.75 10.81 million1.96% 2.97 26.20 million2.064% 2.96 1.73 million1.067% 2.21 11.63 million0.978% 2.03 3.829 million1.235% 2.15 25.64 millionSource: cia World Factbook 2011.support the dense social infrastructure that is one of Europe’s signal achievements?Who will buy the products and services that European firms produce?One possibility is to get more out of the existing population by adjustingdomes tic and eu-wide policy to identify groups that are socially and economicallymarginalised (and, as a result, deeply under-represented in the labour