Making Migration Work - Wetenschappelijke Raad voor het ...
Making Migration Work - Wetenschappelijke Raad voor het ...
Making Migration Work - Wetenschappelijke Raad voor het ...
- No tags were found...

Create successful ePaper yourself
Turn your PDF publications into a flip-book with our unique Google optimized e-Paper software.
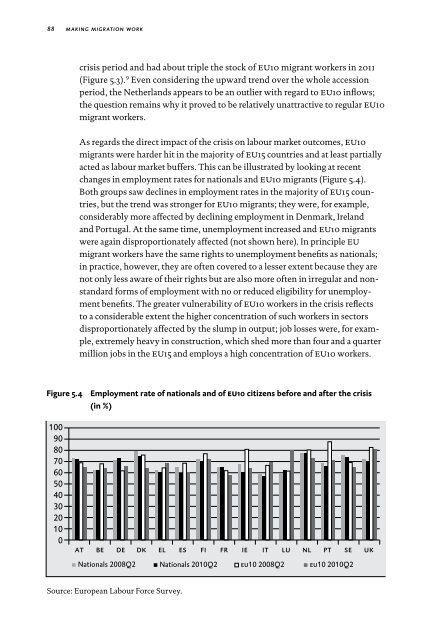
88making migration workcrisis period and had about triple the stock of eu10 migrant workers in 2011(Figure 5.3). 9 Even considering the upward trend over the whole accessionperiod, the Netherlands appears to be an outlier with regard to eu10 inflows;the question remains why it proved to be relatively unattractive to regular eu10migrant workers.As regards the direct impact of the crisis on labour market outcomes, eu10migrants were harder hit in the majority of eu15 countries and at least partiallyacted as labour market buffers. This can be illustrated by looking at recentchanges in employment rates for nationals and eu10 migrants (Figure 5.4).Both groups saw declines in employment rates in the majority of eu15 countries,but the trend was stronger for eu10 migrants; they were, for example,considerably more affected by declining employment in Denmark, Irelandand Portugal. At the same time, unemployment increased and eu10 migrantswere again disproportionately affected (not shown here). In principle eumigrant workers have the same rights to unemployment benefits as nationals;in practice, however, they are often covered to a lesser extent because they arenot only less aware of their rights but are also more often in irregular and nonstandardforms of employment with no or reduced eligibility for unemploymentbenefits. The greater vulnerability of eu10 workers in the crisis reflectsto a considerable extent the higher concentration of such workers in sectorsdisproportionately affected by the slump in output; job losses were, for example,extremely heavy in construction, which shed more than four and a quartermillion jobs in the eu15 and employs a high concentration of eu10 workers.Figure 5.4Employment rate of nationals and of eu10 citizens before and after the crisis(in %)1009080706050403020100at be de dk el es fi fr ie it lu nl pt seNationals 2008Q2 Nationals 2010Q2 eu10 2008Q2 eu10 2010Q2ukSource: European Labour Force Survey.