Making Migration Work - Wetenschappelijke Raad voor het ...
Making Migration Work - Wetenschappelijke Raad voor het ...
Making Migration Work - Wetenschappelijke Raad voor het ...
- No tags were found...

You also want an ePaper? Increase the reach of your titles
YUMPU automatically turns print PDFs into web optimized ePapers that Google loves.
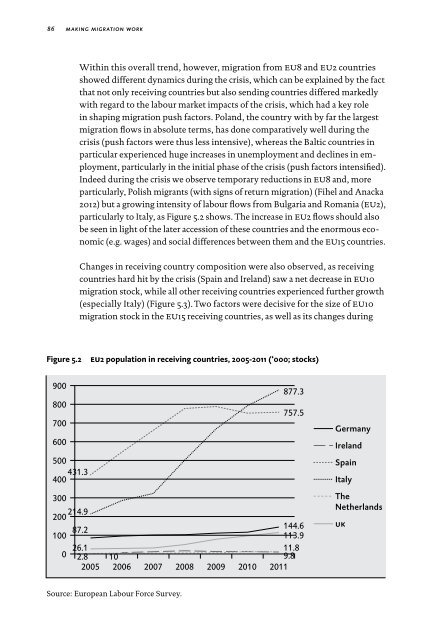
86making migration workWithin this overall trend, however, migration from eu8 and eu2 countriesshowed different dynamics during the crisis, which can be explained by the factthat not only receiving countries but also sending countries differed markedlywith regard to the labour market impacts of the crisis, which had a key rolein shaping migration push factors. Poland, the country with by far the largestmigration flows in absolute terms, has done comparatively well during thecrisis (push factors were thus less intensive), whereas the Baltic countries inparticular experienced huge increases in unemployment and declines in employment,particularly in the initial phase of the crisis (push factors intensified).Indeed during the crisis we observe temporary reductions in eu8 and, moreparticularly, Polish migrants (with signs of return migration) (Fihel and Anacka2012) but a growing intensity of labour flows from Bulgaria and Romania (eu2),particularly to Italy, as Figure 5.2 shows. The increase in eu2 flows should alsobe seen in light of the later accession of these countries and the enormous economic(e.g. wages) and social differences between them and the eu15 countries.Changes in receiving country composition were also observed, as receivingcountries hard hit by the crisis (Spain and Ireland) saw a net decrease in eu10migration stock, while all other receiving countries experienced further growth(especially Italy) (Figure 5.3). Two factors were decisive for the size of eu10migration stock in the eu15 receiving countries, as well as its changes duringFigure 5.2eu2 population in receiving countries, 2005-2011 (‘000; stocks)900800700600500431.3400877.3757.5300214.920087.2144.6100113.926.111.80 2.8 109.82005 2006 2007 2008 2009 2010 2011GermanyIrelandSpainItalyTheNetherlandsukSource: European Labour Force Survey.