112 DELIVERING RESULTSprogrammes, highlighting some of the mostimpressive efforts in the developed anddeveloping world.Several countries now have adoptednational green growth strategies, includingChina, Germany, Mozambique, Rwandaand South Korea. Many others are engagedin serious green economy efforts. Ethiopiahas a Climate-Resilient Green EconomyStrategy in place, aimed at it becominga middle-income country by 2025 whileputting in place measures to reduce growthin GHG emissions and climate-changeimpacts.But as with any broad concept, thedevil is in the detail. Volumes have been(and will continue to be) written aboutwhat constitutes inclusive economicgrowth, wellbeing and sustainability,and how we should measure them. Still,progress on the ground can already beseen in efforts to decouple economicgrowth from environmental degradation,thanks in large part to technologicaladvancements. Particularly in the areaof energy generation, technology is thegreat enabler of green growth, allowingdeveloped countries to drastically reducetheir emissions and developing countriesto leapfrog the dirty industrialisation of the20th century.The SDGs explicitly include, unlikethe MDGs, a specific goal (Goal 7) forsustainable energy access for all, one thataspires to universal energy access, as well assignificant expansions of energy efficiencyPartnership (REEEP) is among a handfulof organisations that have been pushingclean energy transitions in developingcountries for over a decade. REEEPfocuses specifically on catalysing growthin clean energy markets – finding andsupporting businesses that utilise cleanenergy technologies to replace or leapfrogfossil fuel. REEEP also emphasises anothertransition – that from donor funding toParticularly in the area of energy generation,technology is the great enabler of green growthand renewable energy use. SDG 7 is atestament to the efforts of UN Secretary-General Ban Ki-moon’s Sustainable Energyfor All (SE4All) initiative.While some countries in theindustrialised world – for instanceGermany and Nordic countries – haveoften been in the headlines for their energytransformations, the developing world isalso undergoing an energy revolution. TheRenewable Energy and Energy Efficiencyprivate financing, which is necessary forlong-term market sustainability.There are many reasons to thinkthat these efforts are paying off, bothin industrialised, as well as developing,markets. In the past few years, renewableenergy has seen phenomenal rates ofgrowth globally. Bloomberg New EnergyFinance projects that 70 per cent of newpower generation capacity added between2012 and 2030 will be from renewableEntrepreneur Chen Guangbiao in Nanjing,China, during an event he organised to publiclyshame polluting companiestechnologies, compared with only 25 percent from coal, gas or oil. Green energyis also growing fastest in developing andemerging economies. China, for instance,installed a record 12GW – the equivalent of12 nuclear power stations – of solar powerin 2013, which is more than has ever beeninstalled by any country in a single year.The renewable energy industrynow employs over 6.5 million peopleworldwide, and the main growth inemployment levels from this sector isnow in the developing world, the largestnumber of jobs being in China and Brazil.Big changes are also afoot in India, where400 million people lack access to electricity.The government announced in May thatit plans to put solar power in every homeby 2019.The energy sector, long a source ofenvironmental degradation, is becominga force for environmental renewal andinclusive economic growth.© ReutersGLOBAL DEVELOPMENT GOALS 2014
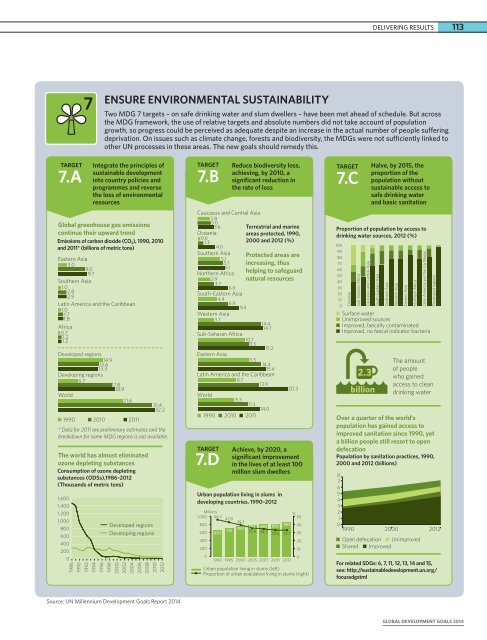
DELIVERING RESULTS1137ENSURE ENVIRONMENTAL SUSTAINABILITYTwo MDG 7 targets – on safe drinking water and slum dwellers – have been met ahead of schedule. But acrossthe MDG framework, the use of relative targets and absolute numbers did not take account of populationgrowth, so progress could be perceived as adequate despite an increase in the actual number of people sufferingdeprivation. On issues such as climate change, forests and biodiversity, the MDGs were not sufficiently linked toother UN processes in these areas. The new goals should remedy this.TARGET7.AIntegrate the principles ofsustainable developmentinto country policies andprogrammes and reversethe loss of environmentalresourcesGlobal greenhouse gas emissionscontinue their upward trendEmissions of carbon dioxide (CO 2 ), 1990, 2010and 2011* (billions of metric tons)Eastern Asia3.09.09.7Southern Asia1.02.82.9Latin America and the Caribbean1.01.71.8Africa0.71.21.2Developed regions14.913.613.3Developing regions6.717.818.9World21.61990 2010 2011* Data for 2011 are preliminary estimates and thebreakdown for some MDG regions is not available.The world has almost eliminatedozone depleting substancesConsumption of ozone depletingsubstances (ODSs),1986–2012(Thousands of metric tons)1,6001,4001,2001,0008006004002000Developed regionsDeveloping regions31.432.21986199019921994199619982000200220042006200820102012TARGET7.BReduce biodiversity loss,achieving, by 2010, asignificant reduction inthe rate of lossCaucasus and Central Asia2.83.03.6Terrestrial and marineOceaniaareas protected, 1990,0.61.3 2000 and 2012 (%)4.0Southern Asia Protected areas are5.15.7 increasing, thus6.1Northern Africa helping to safeguard2.9 natural resources3.76.9South-Eastern Asia4.46.99.4Western Asia3.714.414.7Sub-Saharan Africa10.711.515.2Eastern Asia11.514.415.4Latin America and the Caribbean8.713.9World8.311.314.01990 2010 2011TARGET7.D20.3Achieve, by 2020, asignificant improvementin the lives of at least 100million slum dwellersUrban population living in slums indeveloping countries, 1990–2012Millions46.2%1,0005080040760794 803 820 86360071265035.6 34.3 32.6 32.7 3042.939.340020001990 1995 2000 2005 2007 2010 201220100Urban population living in slums (left)Proportion of urban population living in slums (right)TARGET7.CHalve, by 2015, theproportion of thepopulation withoutsustainable access tosafe drinking waterand basic sanitationProportion of population by access todrinking water sources, 2012 (%)1009080706050403020100Surface waterUnimproved sourcesImproved, faecally contaminatedImproved, no faecal indicator bacteriaOver a quarter of the world’spopulation has gained access toimproved sanitation since 1990, yeta billion people still resort to opendefecationPopulation by sanitation practices, 1990,2000 and 2012 (billions)876543210OceaniaSub-Saharan AfricaCaucasus and Central AsiaSouth-Eastern AsiaSouthern AsiaWestern AsiaEastern AsiaNorthern AfricaLatin America and the CaribbeanDeveloped regions19902.3billionThe amountof peoplewho gainedaccess to cleandrinking water2000 2012Open defecation UnimprovedShared ImprovedFor related SDGs: 6, 7, 11, 12, 13, 14 and 15,see: http://sustainabledevelopment.un.org/focussdgstmlSource: UN Millennium Development Goals Report 2014GLOBAL DEVELOPMENT GOALS 2014