

FAMBB
FAMBB
FAMBB

You also want an ePaper? Increase the reach of your titles
YUMPU automatically turns print PDFs into web optimized ePapers that Google loves.
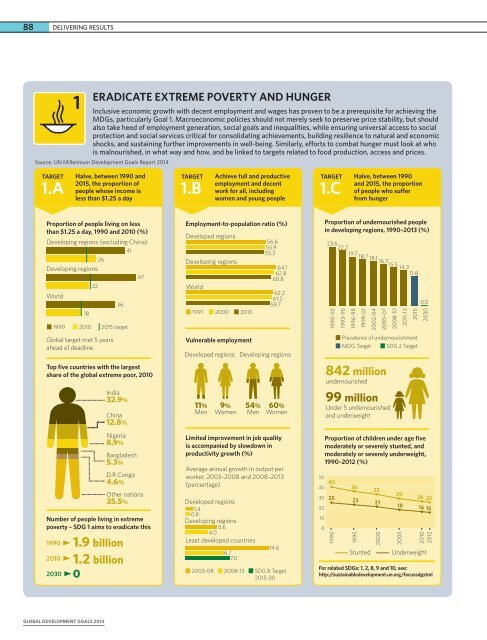
88 DELIVERING RESULTS1ERADICATE EXTREME POVERTY AND HUNGERInclusive economic growth with decent employment and wages has proven to be a prerequisite for achieving theMDGs, particularly Goal 1. Macroeconomic policies should not merely seek to preserve price stability, but shouldalso take heed of employment generation, social goals and inequalities, while ensuring universal access to socialprotection and social services critical for consolidating achievements, building resilience to natural and economicshocks, and sustaining further improvements in well-being. Similarly, efforts to combat hunger must look at whois malnourished, in what way and how, and be linked to targets related to food production, access and prices.Source: UN Millennium Development Goals Report 2014TARGET1.AHalve, between 1990 and2015, the proportion ofpeople whose income isless than $1.25 a dayTARGET1.BAchieve full and productiveemployment and decentwork for all, includingwomen and young peopleTARGET1.CHalve, between 1990and 2015, the proportionof people who sufferfrom hungerProportion of people living on lessthan $1.25 a day, 1990 and 2010 (%)Developing regions (excluding China)4126Developing regions4722World36181990 2010 2015 targetGlobal target met 5 yearsahead of deadlineTop five countries with the largestshare of the global extreme poor, 2010Number of people living in extremepoverty – SDG 1 aims to eradicate this199020102030India32.9%China12.8%Nigeria8.9%Bangladesh5.3%D.R Congo4.6%Other nations35.5%1.9 billion1.2 billion0Employment-to-population ratio (%)Developed regionsDeveloping regionsWorld19912000 2013Vulnerable employmentDeveloped regions11%Men9%Women54%Men56.655.955.264.162.860.862.261.259.760%WomenLimited improvement in job qualityis accompanied by slowdown inproductivity growth (%)Average annual growth in output perworker, 2003–2008 and 2008–2013(percentage)Developed regions1.40.8Developing regions5.64.0Least developed countries6.77.0Developing regions14.62003-08 2008-13 SDG 8 Target2015-30Proportion of undernourished peoplein developing regions, 1990–2013 (%)23.6 22.219.7 18.7 18.1 16.715.514.311.8Prevalence of undernourishmentMDG Target SDG 2 Target842 million99 million0.01990-921993-951996-981999-012002-042005-072008-102011-1320152030undernourishedUnder 5 undernourishedand underweightProportion of children under age fivemoderately or severely stunted, andmoderately or severely underweight,1990–2012 (%)50404030201002519903623 211995Stunted3320002926 2518 16 15200520102012UnderweightFor related SDGs: 1, 2, 8, 9 and 10, see:http://sustainabledevelopment.un.org/focussdgstmlGLOBAL DEVELOPMENT GOALS 2014