Analysis of genome-scale count data in Bioconductor
Analysis of genome-scale count data in Bioconductor
Analysis of genome-scale count data in Bioconductor

Create successful ePaper yourself
Turn your PDF publications into a flip-book with our unique Google optimized e-Paper software.
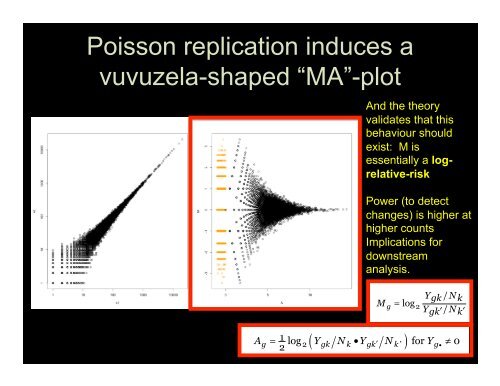
Rob<strong>in</strong>son and Oshlack Genome Biology 2010, 11:R25http://<strong>genome</strong>biology.com/2010/11/3/R25Poisson replication <strong>in</strong>duces avuvuzela-shaped “MA”-plotRob<strong>in</strong>son and Oshlack Genome Biology 2http://<strong>genome</strong>biology.com/2010/11/3/R2The trimmed mean <strong>of</strong> M-values normalization methodThe total RNA production, S k ,cannotbeestimateddirectly, s<strong>in</strong>ce we do not know the expression levels andAnd the theorytrue lengths <strong>of</strong> every gene. The However, trimmed mean the relative <strong>of</strong> M-values RNAnThe validates total RNA that production, thisproduction <strong>of</strong> two samples, f k =S k /S k’ , essentially a globalfold change, can more easily be determ<strong>in</strong>ed. we do not We know pro-thS kdirectly, behaviour s<strong>in</strong>ceshouldtrue exist: lengths M ispose an empirical strategy that equates<strong>of</strong> everythegene.overallHowproduction essentially <strong>of</strong> a two logrelative-riskfold change, can more easilysamples, f k =expression levels <strong>of</strong> genes between samples under thebalassumption that the majority <strong>of</strong> them are not DE. Onepose an empirical strategy thsimple yet robust way to estimateexpressionthelevelsratio<strong>of</strong><strong>of</strong>genesRNA productionuses a weightedassumption trimmed that mean the<strong>of</strong> majority the log <strong>of</strong>Power (to detect betwexpression ratios (trimmedchanges)simple mean<strong>of</strong>Mvalues(TMM)).is higher atyet robust way to estimatFor sequenc<strong>in</strong>g <strong>data</strong>, we def<strong>in</strong>ehigherduction the<strong>count</strong>suses gene-wise a weighted log-foldchangesas:trimImplications forexpression ratios (trimmed meaFor downstream sequenc<strong>in</strong>g <strong>data</strong>, we def<strong>in</strong>eYgk N k changes as:M g / analysis.log 2Ygk / N k Ygk N kM g /log 2and absolute expression levels:Y gk / N k and absolute expression levels:Ag 1 log Ygk Nk YgkNk Yg22’ for 0Ag 1 log Ygk Nk YgkN22To robustly summarize the observed M values, wetrim both the M values and the A values before tak<strong>in</strong>g