Analysis of genome-scale count data in Bioconductor
Analysis of genome-scale count data in Bioconductor
Analysis of genome-scale count data in Bioconductor

Create successful ePaper yourself
Turn your PDF publications into a flip-book with our unique Google optimized e-Paper software.
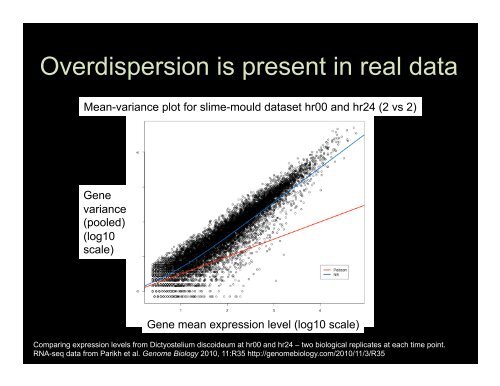
Overdispersion is present <strong>in</strong> real <strong>data</strong>Mean-variance plot for slime-mould <strong>data</strong>set hr00 and hr24 (2 vs 2)Genevariance(pooled)(log10<strong>scale</strong>)Gene mean expression level (log10 <strong>scale</strong>)Compar<strong>in</strong>g expression levels from Dictyostelium discoideum at hr00 and hr24 – two biological replicates at each time po<strong>in</strong>t.RNA-seq <strong>data</strong> from Parikh et al. Genome Biology 2010, 11:R35 http://<strong>genome</strong>biology.com/2010/11/3/R35