view / download the documents. - til india
view / download the documents. - til india
view / download the documents. - til india

You also want an ePaper? Increase the reach of your titles
YUMPU automatically turns print PDFs into web optimized ePapers that Google loves.
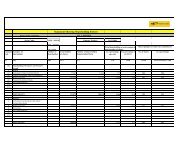
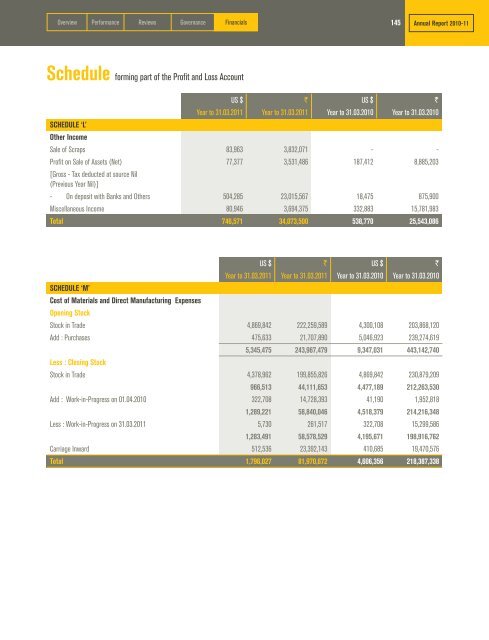
Over<strong>view</strong> Performance Re<strong>view</strong>s Governance Financials145Annual Report 2010-11Schedule forming part of <strong>the</strong> Profit and Loss AccountUS $ ` US $ `Year to 31.03.2011 Year to 31.03.2011 Year to 31.03.2010 Year to 31.03.2010SCHEDULE ‘L’O<strong>the</strong>r IncomeSale of Scraps 83,963 3,832,071 - -Profit on Sale of Assets (Net) 77,377 3,531,486 187,412 8,885,203[Gross - Tax deducted at source Nil(Previous Year Nil)]- On deposit with Banks and O<strong>the</strong>rs 504,285 23,015,567 18,475 875,900Miscellaneous Income 80,946 3,694,375 332,883 15,781,983Total 746,571 34,073,500 538,770 25,543,086US $ ` US $ `Year to 31.03.2011 Year to 31.03.2011 Year to 31.03.2010 Year to 31.03.2010SCHEDULE ‘M’Cost of Materials and Direct Manufacturing ExpensesOpening StockStock in Trade 4,869,842 222,259,589 4,300,108 203,868,120Add : Purchases 475,633 21,707,890 5,046,923 239,274,6195,345,475 243,967,479 9,347,031 443,142,740Less : Closing StockStock in Trade 4,378,962 199,855,826 4,869,842 230,879,209966,513 44,111,653 4,477,189 212,263,530Add : Work-in-Progress on 01.04.2010 322,708 14,728,393 41,190 1,952,8181,289,221 58,840,046 4,518,379 214,216,348Less : Work-in-Progress on 31.03.2011 5,730 261,517 322,708 15,299,5861,283,491 58,578,529 4,195,671 198,916,762Carriage Inward 512,536 23,392,143 410,685 19,470,576Total 1,796,027 81,970,672 4,606,356 218,387,338