76Schedule forming part of <strong>the</strong> Accounts for <strong>the</strong> year ended 31st March, 2011SCHEDULE ‘O’ (Contd.)22.2 Particulars of Cranes and o<strong>the</strong>r classes of Goods Dealt in Stock, Purchases (Trading) and SalesClass of Goodsa) Diesel Hydraulic/ ElectricCranes/ Tower Cranes/ CarrierUnits (Trucks)Opening Stock Transferred to TIPL*** Purchases Sales(Gross) Closing StockUnitof Qty.Qty. Value` ‘000Qty. Value` ‘000Qty. Value` ‘000Qty. Value` ‘000Qty. Value` ‘000Nos. - - - - 1 5,766 106* 1,314,761 8 73,2482 21,320 - - - - 88 1,143,972 - -b) Construction Equipment, etc. Nos. - - - - 3 21,560 3 22,622 - -- - - - - - - - - -c) Earthmoving Equipment, etc. Nos. 52 139,321 52 139,321 - - - - - -116 344,409 - - 800 2,519,380 864 2,673,544 52 139,321d) Diesel Generating Set Nos. - - - - - - - - - -- - - - - - 325 602,563 - -e) Packaged Diesel Generating Set Nos. 14 371,121 14 371,121 - - - - - -38 129,115 - - 132 686,024 156 701,795 14 371,121f) Self-Propelled Rubber Tyred Nos. - - - - - - 18** 300,668 - -Container Handling MobileCrane2 30,242 - - - - 11 193,184 - -g) Forklift etc. Nos. - - - - 3 8,856 3 10,704 - -- - - - - - - - - -h) Goods, Components and Sparesfor Earthmoving and Construction /Material Handling Equipment528,251 467,442 197,632 487,607 76,231435,181 - 1,899,913 2,693,870 528,251i) O<strong>the</strong>rs (Note 14.1) - - - 25,080 -- - - 236,933 -Total 1,038,693 977,884 233,814 2,161,442 149,479Previous year 960,267 - 5,105,317 8,245,861 1,038,693Figures in bold type relate to <strong>the</strong> Current Year* includes nil ( Previous Year 2 ) despatches made from sales return of earlier year.** includes 1 ( Previous Year nil ) despatches made from sales return of earlier year.*** Stock transfer to TIPL as on 1st April,2010 vide Scheme of Arrangement (Refer Note 13 above).With <strong>the</strong> exception of Cranes/ Carrier Units ( Trucks), Earthmoving Equipment,Diesel Generating Sets and Self-Propelled Rubber Tyred Container Handling MobileCrane mentioned above ,none of <strong>the</strong> items included in <strong>the</strong> above classes of goods exceeded individually 10% of <strong>the</strong> total value of Purchases, Stock or Turnoverand accordingly quantitative information has not been provided for.
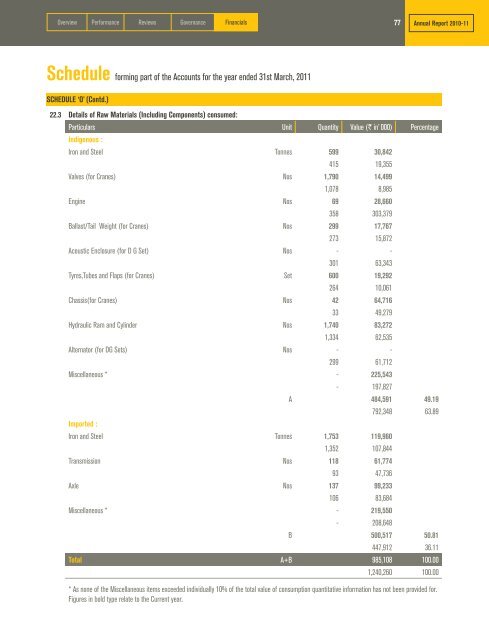
Over<strong>view</strong> Performance Re<strong>view</strong>s Governance Financials77Annual Report 2010-11Schedule forming part of <strong>the</strong> Accounts for <strong>the</strong> year ended 31st March, 2011SCHEDULE ‘O’ (Contd.)22.3 Details of Raw Materials (Including Components) consumed:Particulars Unit Quantity Value (` in’ 000) PercentageIndigenous :Iron and Steel Tonnes 599 30,842415 19,355Valves (for Cranes) Nos 1,790 14,4991,078 8,985Engine Nos 69 28,660358 303,379Ballast/Tail Weight (for Cranes) Nos 299 17,767273 15,872Acoustic Enclosure (for D G Set) Nos - -301 63,343Tyres,Tubes and Flaps (for Cranes) Set 600 19,292264 10,061Chassis(for Cranes) Nos 42 64,71633 49,279Hydraulic Ram and Cylinder Nos 1,740 83,2721,334 62,535Alternator (for DG Sets) Nos - -299 61,712Miscellaneous * - 225,543- 197,827A 484,591 49.19792,348 63.89Imported :Iron and Steel Tonnes 1,753 119,9601,352 107,844Transmission Nos 118 61,77493 47,736Axle Nos 137 99,233106 83,684Miscellaneous * - 219,550- 208,648B 500,517 50.81447,912 36.11Total A+B 985,108 100.001,240,260 100.00* As none of <strong>the</strong> Miscellaneous items exceeded individually 10% of <strong>the</strong> total value of consumption quantitative information has not been provided for.Figures in bold type relate to <strong>the</strong> Current year.