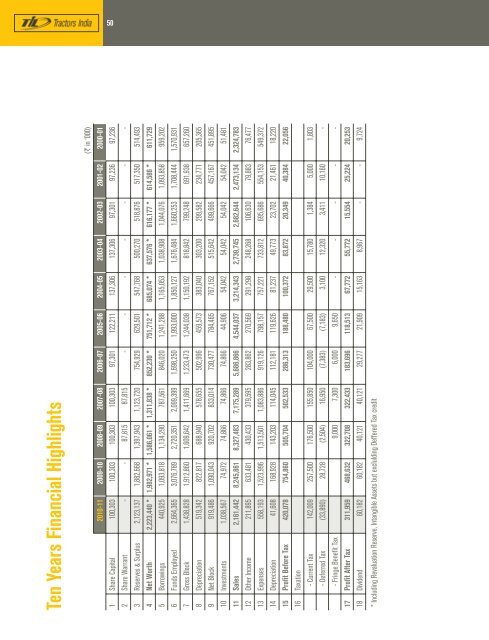
50Ten Years Financial Highlights(` in ‘000)2010-11 2009-10 2008-09 2007-08 2006-07 2005-06 2004-05 2003-04 2002-03 2001-02 2000-011 Share Capital 100,303 100,303 100,303 100,303 97,301 122,211 137,306 137,306 97,301 97,236 97,2362 Share Warrant - - 87,815 87,815 - - - - - - -3 Reserves & Surplus 2,123,137 1,882,668 1,397,943 1,123,720 754,929 629,501 547,768 500,270 518,876 517,350 514,4934 Net Worth 2,223,440 * 1,982,971 * 1,586,061 * 1,311,838 * 852,230 * 751,712 * 685,074 * 637,576 * 616,177 * 614,586 * 611,7295 Borrowings 440,925 1,093,818 1,134,290 787,561 846,020 1,241,288 1,165,053 1,038,908 1,044,076 1,093,858 959,2026 Funds Employed 2,664,365 3,076,789 2,720,351 2,099,399 1,698,250 1,993,000 1,850,127 1,676,484 1,660,253 1,708,444 1,570,9317 Gross Block 1,438,828 1,912,860 1,609,642 1,411,669 1,233,473 1,244,038 1,150,192 818,842 799,248 691,938 657,2608 Depreciation 519,342 822,817 688,940 578,655 502,996 459,573 383,040 303,200 299,582 234,771 205,3659 Net Block 919,486 1,090,043 920,702 833,014 730,477 784,465 767,152 515,642 499,666 457,167 451,89510 Investments 1,038,567 74,972 74,866 74,866 74,866 44,906 54,042 54,042 54,042 54,042 51,48111 Sales 2,161,442 8,245,861 8,327,483 7,175,289 5,686,866 4,544,037 3,214,343 2,739,745 2,682,644 2,473,134 2,324,78312 O<strong>the</strong>r Income 211,895 633,481 430,433 379,595 283,862 270,569 291,298 248,268 106,630 79,883 76,47713 Expenses 558,193 1,523,996 1,513,501 1,083,886 919,126 798,157 757,221 733,812 695,686 554,153 549,37214 Depreciation 41,608 168,928 143,203 114,045 112,181 119,626 81,237 49,773 23,702 21,461 18,22015 Profit Before Tax 420,078 754,860 505,704 502,533 286,313 188,480 100,372 83,872 20,349 40,384 22,05616 Taxation- Current Tax 142,009 257,500 176,500 155,850 104,000 67,500 29,500 15,780 1,384 5,000 1,803- Deferred Tax (33,890) 28,728 (2,504) 16,950 (7,383) (7,183) 3,100 12,320 3,411 10,160 -- Fringe Benefit Tax 9,000 7,300 6,000 9,650 - - - - -17 Profit After Tax 311,959 468,632 322,708 322,433 183,696 118,513 67,772 55,772 15,554 25,224 20,25318 Dividend 60,182 60,182 40,121 40,121 29,277 21,909 15,163 8,967 - - 9,724* Including Revaluation Reserve, Intangible Assets but exclulding Deffered Tax credit
Over<strong>view</strong> Performance Re<strong>view</strong>s Governance Financials51Annual Report 2010-11Auditors’ Report to <strong>the</strong> Members of TIL Limited1. We have audited <strong>the</strong> attached Balance Sheet of TIL Limited (<strong>the</strong> ‘Company’)as at 31st March, 2011, and <strong>the</strong> related Profit and Loss Account and <strong>the</strong> CashFlow Statement for <strong>the</strong> year ended on that date annexed <strong>the</strong>reto, which we have signed under reference to this report. These financial statements are <strong>the</strong>responsibility of <strong>the</strong> Company’s management. Our responsibility is to express an opinion on <strong>the</strong>se financial statements based on our audit.2. We conducted our audit in accordance with auditing standards generally accepted in India. Those Standards require that we plan and perform <strong>the</strong>audit to obtain reasonable assurance about whe<strong>the</strong>r <strong>the</strong> financial statements are free of material misstatement. An audit includes, examining on a testbasis, evidence supporting <strong>the</strong> amounts and disclosures in <strong>the</strong> financial statements. An audit also includes assessing <strong>the</strong> accounting principles usedand significant estimates made by management, as well as evaluating <strong>the</strong> overall financial statement presentation. We believe that our audit providesreasonable basis for our opinion.3. As required by <strong>the</strong> Companies (Auditor’s Report) Order, 2003, as amended by <strong>the</strong> Companies (Auditor’s Report) (Amendment) Order,2004 (toge<strong>the</strong>r <strong>the</strong>‘Order’), issued by <strong>the</strong> Central Government of India in terms of sub-section (4A) of Section 227 of ‘The Companies Act, 1956’ of India (<strong>the</strong> ‘Act’) and on <strong>the</strong>basis of such checks of <strong>the</strong> books and records of <strong>the</strong> Company as we considered appropriate and according to <strong>the</strong> information and explanations given tous, we give in <strong>the</strong> Annexure a statement on <strong>the</strong> matters specified in paragraphs 4 and 5 of <strong>the</strong> Order.4. Fur<strong>the</strong>r to our comments in <strong>the</strong> Annexure referred to in paragraph 3 above, we report that:a) We have obtained all <strong>the</strong> information and explanations which, to <strong>the</strong> best of our knowledge and belief, were necessary for <strong>the</strong> purposes of our audit;b) In our opinion, proper books of account as required by law have been kept by <strong>the</strong> Company so far as appears from our examination of those books;c) The Balance Sheet, <strong>the</strong> Profit and Loss Account and <strong>the</strong> Cash Flow Statement dealt with by this report are in agreement with <strong>the</strong> books of account;d) In our opinion, <strong>the</strong> Balance Sheet, <strong>the</strong> Profit and Loss Account and <strong>the</strong> Cash Flow Statement dealt with by this report comply with <strong>the</strong> applicableaccounting standards referred to in sub-section (3C) of Section 211 of <strong>the</strong> Act;e) On <strong>the</strong> basis of written representations received from <strong>the</strong> directors , as on 31st March, 2011, and taken on record by <strong>the</strong> Board of Directors, none of<strong>the</strong> directors is disqualified as on 31st March, 2011 from being appointed as a director in terms of clause (g) of sub – section (1) of Section 274 of<strong>the</strong> Act;f) In our opinion and to <strong>the</strong> best of our information and according to <strong>the</strong> explanations given to us, <strong>the</strong> said financial statements toge<strong>the</strong>r with <strong>the</strong> notes<strong>the</strong>reon and attached <strong>the</strong>reto give, in <strong>the</strong> prescribed manner, <strong>the</strong> information required by <strong>the</strong> Act, and give a true and fair <strong>view</strong> in conformity with<strong>the</strong> accounting principles generally accepted in India :i) in <strong>the</strong> case of <strong>the</strong> Balance Sheet, of <strong>the</strong> state of affairs of <strong>the</strong> Company as at 31st March, 2011;ii)iii)in <strong>the</strong> case of <strong>the</strong> Profit and Loss Account, of <strong>the</strong> profit for <strong>the</strong> year ended on that date; andin <strong>the</strong> case of Cash Flow Statement, of <strong>the</strong> cash flows for <strong>the</strong> year ended on that date.For Price WaterhouseFirm Registration Number - 301112EChartered AccountantsP. LawPlace: KolkataPartnerDate: 17th May, 2011 Membership Number – 51790