182Schedule forming part of <strong>the</strong> Accounts for <strong>the</strong> year ended 31st March, 2011SCHEDULE ‘P’Significant Accounting Policies and Notes to <strong>the</strong> Accounts1. Accounting PoliciesA. Accounting Convention:The financial statements are prepared under <strong>the</strong> historical cost convention in accordance with <strong>the</strong> relevant Indian/International Accounting Standardsas applicable.B. Fixed Assets:Fixed assets are stated at cost and are inclusive of all expenses to <strong>the</strong> date of commissioning/ putting <strong>the</strong> assets to use. Borrowing cost <strong>til</strong>l <strong>the</strong> dateit comes into use is capitalized as part of expenses.Assets under construction are shown as Capital work-in-progress.C. Depreciation:Depreciation is provided for as prescribed in Schedule XIV of <strong>the</strong> Indian Companies Act 1956 as amended on straight – line method at <strong>the</strong> ratesmentioned below. Depreciation on addition is provided from <strong>the</strong> succeeding month of <strong>the</strong> purchases of fixed assets.Plant & Machineries 4.75%Computer & Accessories 16.21%Furniture 6.33%Building on leased land 20%Vehicle 20%Fixed Assets under construction is shown under Capital work-in-progress.D. Sales and o<strong>the</strong>r incomeRevenue from sales and services is recognized on accrual basis on issuing <strong>the</strong> tax invoice and stated net of VAT. Commission income is recognizedon <strong>the</strong> settlement basis after confirmation.E. Deferred Revenue Expenses:Deferred revenue expenses are written off over <strong>the</strong> period of five years from <strong>the</strong> year of operation/expensed.F. Inventories:(i) Stock of spares and consumable store is valued at cost on weighted average cost basis and stated net of write-off.(ii) Work-in-Progress is valued on <strong>the</strong> percentage of completion basis.G. Tax ProvisionIncome tax provision is based on <strong>the</strong> Nepalese Income Tax Laws which is 25% on taxable income as computed on <strong>the</strong> taxable Profit.H. Employee Benefits1. Short term employee benefits (i.e. benefits payable within one year) are recognized in <strong>the</strong> period in which employee services are rendered.2. Contributions towards provident funds are recognized as expenses.3. Provisions for Gratuity for eligible employees are made on <strong>the</strong> basis of local labour laws.Notes to <strong>the</strong> AccountsA. Contingent liabilities1. One of our past customer, Hetauda Cements Factory Limited had filed a case against our Company relating to wrong parts supply made by TIL fora value of Nrs. 920,415.71, for which <strong>the</strong> appellate court has decided in favor of <strong>the</strong> customer. The Company has filed <strong>the</strong> case at Supreme Courtagainst <strong>the</strong> above decision for which no provision in <strong>the</strong> accounts has been made as <strong>the</strong> case is s<strong>til</strong>l pending.2. Inland Revenue Office has carried out full audit for <strong>the</strong> three fiscal year upto July 16, 2008 demanding Nrs. 5.01 million for VAT and income taxesagainst which we have appealed to Director General for administrative re<strong>view</strong> by depositing Nrs. 1.655 million. DG of IRD has decided <strong>the</strong> case onVAT in our favour but <strong>the</strong> letter of refund of our deposit is yet to receive by us.B. Commission incomeCommission income amounting to Nrs. 10, 988,467.73 as accrued but not yet received calculated on <strong>the</strong> difference between customer invoice and dealerinvoice is subject to confirmation with CAT Singapore.
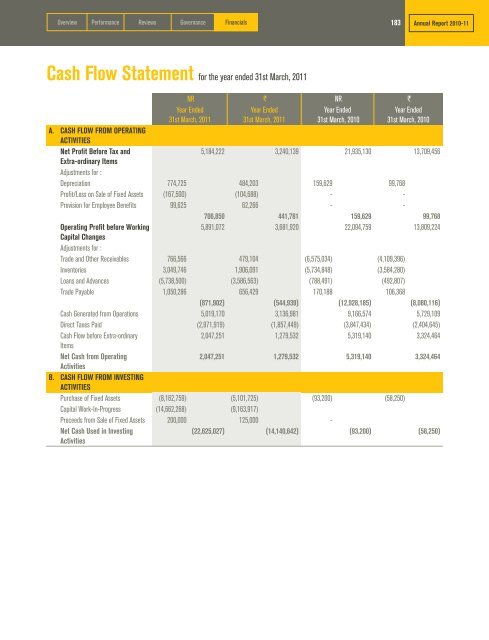
Over<strong>view</strong> Performance Re<strong>view</strong>s Governance Financials183Annual Report 2010-11Cash Flow Statement for <strong>the</strong> year ended 31st March, 2011NR ` NR `Year EndedYear Ended31st March, 2011 31st March, 2010Year Ended31st March, 2011Year Ended31st March, 2010A. CASH FLOW FROM OPERATINGACTIVITIESNet Profit Before Tax and5,184,222 3,240,139 21,935,130 13,709,456Extra-ordinary ItemsAdjustments for :Depreciation 774,725 484,203 159,629 99,768Profit/Loss on Sale of Fixed Assets (167,500) (104,688) - -Provision for Employee Benefits 99,625 62,266 - -706,850 441,781 159,629 99,768Operating Profit before Working5,891,072 3,681,920 22,094,759 13,809,224Capital ChangesAdjustments for :Trade and O<strong>the</strong>r Receivables 766,566 479,104 (6,575,034) (4,109,396)Inventories 3,049,746 1,906,091 (5,734,848) (3,584,280)Loans and Advances (5,738,500) (3,586,563) (788,491) (492,807)Trade Payable 1,050,286 656,429 170,188 106,368(871,902) (544,939) (12,928,185) (8,080,116)Cash Generated from Operations 5,019,170 3,136,981 9,166,574 5,729,109Direct Taxes Paid (2,971,919) (1,857,449) (3,847,434) (2,404,645)Cash Flow before Extra-ordinary2,047,251 1,279,532 5,319,140 3,324,464ItemsNet Cash from Operating2,047,251 1,279,532 5,319,140 3,324,464ActivitiesB. CASH FLOW FROM INVESTINGACTIVITIESPurchase of Fixed Assets (8,162,759) (5,101,725) (93,200) (58,250)Capital Work-In-Progress (14,662,268) (9,163,917)Proceeds from Sale of Fixed Assets 200,000 125,000 -Net Cash Used in InvestingActivities(22,625,027) (14,140,642) (93,200) (58,250)
- Page 1 and 2:
TIL LimitedAnnual Report 2010 -11
- Page 3 and 4:
Annual Report 2010-11Corporateinfor
- Page 5 and 6:
Overview Performance Reviews Govern
- Page 7 and 8:
Overview Performance Reviews Govern
- Page 9 and 10:
Overview Performance Reviews Govern
- Page 11 and 12:
Overview Performance Reviews Govern
- Page 13 and 14:
Overview Performance Reviews Govern
- Page 15 and 16:
Overview Performance Reviews Govern
- Page 17 and 18:
Overview Performance Reviews Govern
- Page 19 and 20:
Overview Performance Reviews Govern
- Page 21 and 22:
Overview Performance Reviews Govern
- Page 23 and 24:
Overview Performance Reviews Govern
- Page 25 and 26:
Overview Performance Reviews Govern
- Page 27 and 28:
Overview Performance Reviews Govern
- Page 29 and 30:
Overview Performance Reviews Govern
- Page 31 and 32:
Overview Performance Reviews Govern
- Page 33 and 34:
Overview Performance Reviews Govern
- Page 35 and 36:
Overview Performance Reviews Govern
- Page 37 and 38:
Overview Performance Reviews Govern
- Page 39 and 40:
Overview Performance Reviews Govern
- Page 41 and 42:
Overview Performance Reviews Govern
- Page 43 and 44:
Overview Performance Reviews Govern
- Page 45 and 46:
Overview Performance Reviews Govern
- Page 47 and 48:
Overview Performance Reviews Govern
- Page 49 and 50:
Overview Performance Reviews Govern
- Page 51 and 52:
Overview Performance Reviews Govern
- Page 53 and 54:
Overview Performance Reviews Govern
- Page 55 and 56:
Overview Performance Reviews Govern
- Page 57 and 58:
Overview Performance Reviews Govern
- Page 59 and 60:
Overview Performance Reviews Govern
- Page 61 and 62:
Overview Performance Reviews Govern
- Page 63 and 64:
Overview Performance Reviews Govern
- Page 65 and 66:
Overview Performance Reviews Govern
- Page 67 and 68:
Overview Performance Reviews Govern
- Page 69 and 70:
Overview Performance Reviews Govern
- Page 71 and 72:
Overview Performance Reviews Govern
- Page 73 and 74:
Overview Performance Reviews Govern
- Page 75 and 76:
Overview Performance Reviews Govern
- Page 77 and 78:
Overview Performance Reviews Govern
- Page 79 and 80:
Overview Performance Reviews Govern
- Page 81 and 82:
Overview Performance Reviews Govern
- Page 83 and 84:
Overview Performance Reviews Govern
- Page 85 and 86:
Overview Performance Reviews Govern
- Page 87 and 88:
Overview Performance Reviews Govern
- Page 89 and 90:
Overview Performance Reviews Govern
- Page 91 and 92:
Overview Performance Reviews Govern
- Page 93 and 94:
Overview Performance Reviews Govern
- Page 95 and 96:
Overview Performance Reviews Govern
- Page 97 and 98:
Overview Performance Reviews Govern
- Page 99 and 100:
Overview Performance Reviews Govern
- Page 101 and 102:
Overview Performance Reviews Govern
- Page 103 and 104:
Overview Performance Reviews Govern
- Page 105 and 106:
Overview Performance Reviews Govern
- Page 107 and 108:
Overview Performance Reviews Govern
- Page 109 and 110:
Overview Performance Reviews Govern
- Page 111 and 112:
Overview Performance Reviews Govern
- Page 113 and 114:
Overview Performance Reviews Govern
- Page 115 and 116:
Overview Performance Reviews Govern
- Page 117 and 118:
Overview Performance Reviews Govern
- Page 119 and 120:
Overview Performance Reviews Govern
- Page 121 and 122:
Overview Performance Reviews Govern
- Page 123 and 124:
Overview Performance Reviews Govern
- Page 125 and 126:
Overview Performance Reviews Govern
- Page 127 and 128:
Overview Performance Reviews Govern
- Page 129 and 130:
Overview Performance Reviews Govern
- Page 131 and 132:
Overview Performance Reviews Govern
- Page 133 and 134: Overview Performance Reviews Govern
- Page 135 and 136: Overview Performance Reviews Govern
- Page 137 and 138: Overview Performance Reviews Govern
- Page 139 and 140: Overview Performance Reviews Govern
- Page 141 and 142: Overview Performance Reviews Govern
- Page 143 and 144: Overview Performance Reviews Govern
- Page 145 and 146: Overview Performance Reviews Govern
- Page 147 and 148: Overview Performance Reviews Govern
- Page 149 and 150: Overview Performance Reviews Govern
- Page 151 and 152: Overview Performance Reviews Govern
- Page 153 and 154: Overview Performance Reviews Govern
- Page 155 and 156: Overview Performance Reviews Govern
- Page 157 and 158: Overview Performance Reviews Govern
- Page 159 and 160: Overview Performance Reviews Govern
- Page 161 and 162: Overview Performance Reviews Govern
- Page 163 and 164: Overview Performance Reviews Govern
- Page 165 and 166: Overview Performance Reviews Govern
- Page 167 and 168: Overview Performance Reviews Govern
- Page 169 and 170: Overview Performance Reviews Govern
- Page 171 and 172: Overview Performance Reviews Govern
- Page 173 and 174: Overview Performance Reviews Govern
- Page 175 and 176: Overview Performance Reviews Govern
- Page 177 and 178: Overview Performance Reviews Govern
- Page 179 and 180: Overview Performance Reviews Govern
- Page 181 and 182: Overview Performance Reviews Govern
- Page 183: Overview Performance Reviews Govern
- Page 187 and 188: “We make our customers more profi