view / download the documents. - til india
view / download the documents. - til india
view / download the documents. - til india

You also want an ePaper? Increase the reach of your titles
YUMPU automatically turns print PDFs into web optimized ePapers that Google loves.
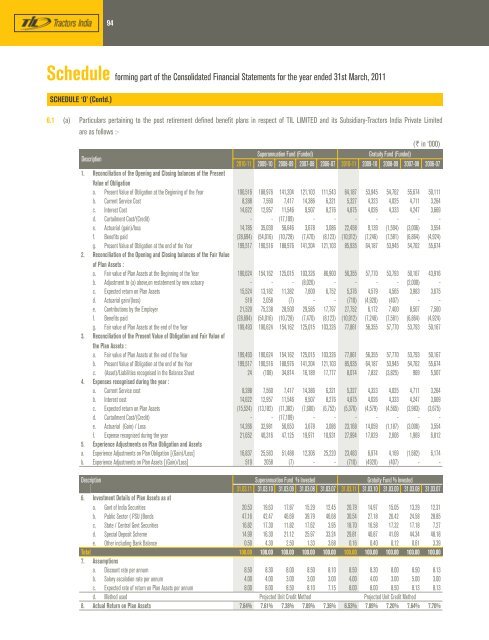
94Schedule forming part of <strong>the</strong> Consolidated Financial Statements for <strong>the</strong> year ended 31st March, 2011SCHEDULE ‘O’ (Contd.)6.1 (a) Particulars pertaining to <strong>the</strong> post retirement defined benefit plans in respect of TIL LIMITED and its Subsidiary-Tractors India Private Limitedare as follows :-(` in ‘000)DescriptionSuperannuation Fund (Funded)Gratuity Fund (Funded)2010-11 2009-10 2008-09 2007-08 2006-07 2010-11 2009-10 2008-09 2007-08 2006-071. Reconciliation of <strong>the</strong> Opening and Closing balances of <strong>the</strong> PresentValue of Obligationa. Present Value of Obligation at <strong>the</strong> Beginning of <strong>the</strong> Year 190,516 188,976 141,204 121,103 111,543 64,187 53,945 54,762 55,674 50,111b. Current Service Cost 8,288 7,560 7,417 14,386 6,321 5,327 4,323 4,025 4,711 3,264c. Interest Cost 14,622 12,957 11,546 9,507 8,276 4,875 4,026 4,333 4,247 3,669d. Curtailment Cost/(Credit) - - (17,109) - - - - - - -e. Actuarial (gain)/loss 14,785 35,039 56,646 3,678 3,086 22,458 9,139 (1,594) (3,006) 3,554f. Benefits paid (28,694) (54,016) (10,728) (7,470) (8,123) (10,912) (7,246) (7,581) (6,864) (4,924)g. Present Value of Obligation at <strong>the</strong> end of <strong>the</strong> Year 199,517 190,516 188,976 141,204 121,103 85,935 64,187 53,945 54,762 55,6742. Reconciliation of <strong>the</strong> Opening and Closing balances of <strong>the</strong> Fair Valueof Plan Assets :a. Fair value of Plan Assets at <strong>the</strong> Beginning of <strong>the</strong> Year 190,624 154,162 125,015 103,326 86,900 56,355 57,770 53,793 50,167 43,916b. Adjustment to (a) above,on restatement by new actuary - - - (8,026) - - - - (2,000) -c. Expected return on Plan Assets 15,524 13,182 11,382 7,600 6,752 5,376 4,579 4,565 3,983 3,675d. Actuarial gain/(loss) 519 2,058 (7) - - (710) (4,920) (407) - -e. Contributions by <strong>the</strong> Employer 21,520 75,238 28,500 29,585 17,797 27,752 6,172 7,400 8,507 7,500f. Benefits paid (28,694) (54,016) (10,728) (7,470) (8,123) (10,912) (7,246) (7,581) (6,864) (4,924)g. Fair value of Plan Assets at <strong>the</strong> end of <strong>the</strong> Year 199,493 190,624 154,162 125,015 103,326 77,861 56,355 57,770 53,793 50,1673. Reconciliation of <strong>the</strong> Present Value of Obligation and Fair Value of<strong>the</strong> Plan Assets :a. Fair value of Plan Assets at <strong>the</strong> end of <strong>the</strong> Year 199,493 190,624 154,162 125,015 103,326 77,861 56,355 57,770 53,793 50,167b. Present Value of Obligation at <strong>the</strong> end of <strong>the</strong> Year 199,517 190,516 188,976 141,204 121,103 85,935 64,187 53,945 54,762 55,674c. (Asset)/Liabilities recognised in <strong>the</strong> Balance Sheet 24 (108) 34,814 16,189 17,777 8,074 7,832 (3,825) 969 5,5074. Expenses recognised during <strong>the</strong> year :a. Current Service cost 8,288 7,560 7,417 14,386 6,321 5,327 4,323 4,025 4,711 3,264b. Interest cost 14,622 12,957 11,546 9,507 8,276 4,875 4,026 4,333 4,247 3,669c. Expected return on Plan Assets (15,524) (13,182) (11,382) (7,600) (6,752) (5,376) (4,579) (4,565) (3,983) (3,675)d. Curtailment Cost/(Credit) - - (17,109) - - - - - - -e. Actuarial (Gain) / Loss 14,266 32,981 56,653 3,678 3,086 23,168 14,059 (1,187) (3,006) 3,554f. Expense recognised during <strong>the</strong> year 21,652 40,316 47,125 19,971 10,931 27,994 17,829 2,606 1,969 6,8125. Experience Adjustments on Plan Obligation and Assetsa. Experience Adjustments on Plan Obligation [(Gain)/Loss] 16,837 25,583 51,488 12,306 25,220 23,483 6,974 4,169 (1,682) 6,174b. Experience Adjustments on Plan Assets [(Gain)/Loss] 519 2058 (7) - - (710) (4920) (407) - -Description Superannuation Fund % Invested Gratuity Fund % Invested31.03.11 31.03.10 31.03.09 31.03.08 31.03.07 31.03.11 31.03.10 31.03.09 31.03.08 31.03.076. Investment Details of Plan Assets as ata. Govt of India Securities 20.53 19.63 17.87 15.29 12.45 20.79 14.97 15.05 13.29 12.31b. Public Sector ( PSU )Bonds 47.16 42.47 46.69 39.79 46.68 30.54 27.18 26.42 24.58 28.85c. State / Central Govt Securities 16.82 17.30 11.82 17.62 3.95 18.70 16.58 17.32 17.18 7.27d. Special Deposit Scheme 14.99 16.30 21.12 25.97 33.24 29.81 40.87 41.09 44.34 48.18e. O<strong>the</strong>r including Bank Balance 0.50 4.30 2.50 1.33 3.68 0.16 0.40 0.12 0.61 3.39Total 100.00 100.00 100.00 100.00 100.00 100.00 100.00 100.00 100.00 100.007. Assumptionsa. Discount rate per annum 8.50 8.30 8.00 8.50 8.10 8.50 8.30 8.00 8.50 8.13b. Salary escalation rate per annum 4.00 4.00 3.00 3.00 3.00 4.00 4.00 3.00 5.00 3.00c. Expected rate of return on Plan Assets per annum 8.00 8.00 8.50 8.10 7.15 8.00 8.00 8.50 8.13 8.13d. Method used Projected Unit Credit Method Projected Unit Credit Method8. Actual Return on Plan Assets 7.64% 7.61% 7.38% 7.09% 7.36% 6.53% 7.89% 7.20% 7.64% 7.70%