Five-year financial reviewfor the years ended 31 MarchThe information included in the five-year summary for the year ended 31 March 2004 is as published under UK GAAP and has not beenrestated to IFRS.IFRS IFRS IFRS IFRS UK GAAP UK GAAP2008 2007 2006 (1) 2005 2005 2004US$m US$m US$m US$m US$m US$mIncome statementsRevenue (including associates’ share) 23,828 20,645 17,081 14,543 14,543 12,645Revenue (excluding associates’ share) 21,410 18,620 15,307 12,901 12,901 11,366Operating profit 3,448 3,027 2,575 2,547 2,104 1,383Net finance costs (456) (428) (299) (143) (143) (152)Share of associates post-tax results (3) 272 205 177 148 159 115Taxation (976) (921) (779) (823) (776) (534)Minority interests (265) (234) (234) (208) (203) (167)Profit for the year 2,023 1,649 1,440 1,521 1,141 645Adjusted earnings 2,147 1,796 1,497 1,224 1,251 925Balance sheetsNon-current assets 31,686 25,683 24,286 12,869 12,287 11,483Current assets 4,127 3,053 2,829 2,778 2,941 2,316Total assets 35,813 28,736 27,115 15,647 15,228 13,799Derivative financial instruments (531) (209) (178) – – –Borrowings (9,658) (7,231) (7,602) (3,340) (3,339) (3,707)Other liabilities and provisions (7,380) (6,295) (5,750) (3,552) (3,586) (3,108)Total liabilities (17,569) (13,735) (13,530) (6,892) (6,925) (6,815)Net assets 18,244 15,001 13,585 8,755 8,303 6,984Total shareholders’ equity 17,545 14,406 13,043 8,077 7,665 6,165Minority interests in equity 699 595 542 678 638 819Total equity 18,244 15,001 13,585 8,755 8,303 6,984Cash flow statementsEBITDA 4,518 4,031 3,348 2,736 2,740 2,185Net working capital movements (242) (13) (57) 56 52 107Net cash generated from operations 4,276 4,018 3,291 2,792 2,792 2,292Net interest paid (net of dividends received) (410) (385) (248) (79) (79) (132)Tax paid (969) (801) (869) (625) (625) (456)Net cash inflow from operating activities 2,897 2,832 2,174 2,088 2,088 1,704Net capital expenditure (1,927) (1,351) (984) (738) (738) (549)Net investments 5 (2) (2) 456 456 (211)Net acquisition of subsidiaries and associates (1,439) (429) (2,644) (897) (897) (515)Net cash inflow before financing and dividends (464) 1,050 (1,456) 909 909 429Management of liquid resources (UK GAAP only) – – – – (658) (16)Net cash (outflow)/inflow from financing 1,240 (455) 1,733 (271) (272) (142)Dividends paid (769) (681) (520) (412) (412) (309)Effect of exchange rates (113) (18) 11 (56) – –(Decrease)/increase in cash and cash equivalents (106) (104) (232) 170 (433) (38)Per share information (US cents per share)Basic earnings per share 134.9 110.2 105.0 125.5 94.1 54.1Diluted earnings per share 134.2 109.5 104.3 121.2 91.1 53.0Adjusted basic earnings per share 143.1 120.0 109.1 101.0 103.2 77.6Net asset value per share 1,108.3 912.0 828.0 599.9 569.2 484.4Total number of shares in issue (millions) 1,583.1 1,579.6 1,575.2 1,346.5 1,346.5 1,272.7Other operating and financial statisticsReturn on equity (%) 12.2 12.5 11.5 15.2 16.3 15.0EBITA margin (%) 17.4 17.4 17.2 16.4 14.0 12.2Post exceptional EBITDA margin (%) 21.1 21.6 21.9 21.2 21.2 19.3PBIT interest cover (times) 8.2 7.6 9.2 14.4 12.2 8.2Total borrowings to total assets (%) 27.0 25.2 28.0 21.3 21.9 26.9Cash flow to total borrowings (%) 44.3 55.6 43.3 83.6 83.6 61.8Group turnover per employee (US$000s) 309.8 278.1 284.7 315.5 315.5 287.2Average monthly number of employees 69,116 66,949 53,772 40,892 40,892 39,571(1) Restated for the adjustments made to the provisional fair values relating to the Bavaria Group transaction.(2) UK GAAP information for share of associates’ results has been presented on the same basis as IFRS for ease of comparability.146 Five-year financial review<strong>SABMiller</strong> plc <strong>Annual</strong> <strong>Report</strong> 2008
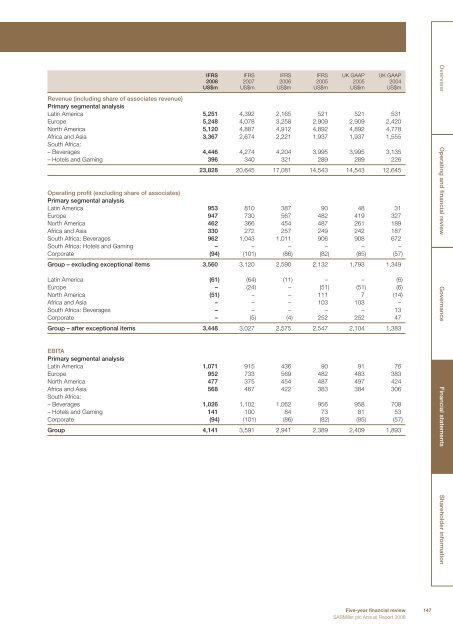
IFRS IFRS IFRS IFRS UK GAAP UK GAAP2008 2007 2006 2005 2005 2004US$m US$m US$m US$m US$m US$mRevenue (including share of associates revenue)Primary segmental analysisLatin America 5,251 4,392 2,165 521 521 531Europe 5,248 4,078 3,258 2,909 2,909 2,420North America 5,120 4,887 4,912 4,892 4,892 4,778Africa and Asia 3,367 2,674 2,221 1,937 1,937 1,555South Africa:– Beverages 4,446 4,274 4,204 3,995 3,995 3,135– Hotels and Gaming 396 340 321 289 289 22623,828 20,645 17,081 14,543 14,543 12,645Operating profit (excluding share of associates)Primary segmental analysisLatin America 953 810 387 90 48 31Europe 947 730 567 482 419 327North America 462 366 454 487 261 189Africa and Asia 330 272 257 249 242 187South Africa: Beverages 962 1,043 1,011 906 908 672South Africa: Hotels and Gaming – – – – – –Corporate (94) (101) (86) (82) (85) (57)Group – excluding exceptional items 3,560 3,120 2,590 2,132 1,793 1,349Latin America (61) (64) (11) – – (6)Europe – (24) – (51) (51) (6)North America (51) – – 111 7 (14)Africa and Asia – – – 103 103 –South Africa: Beverages – – – – – 13Corporate – (5) (4) 252 252 47Group – after exceptional items 3,448 3,027 2,575 2,547 2,104 1,383EBITAPrimary segmental analysisLatin America 1,071 915 436 90 91 76Europe 952 733 569 482 483 383North America 477 375 454 487 497 424Africa and Asia 568 467 422 383 384 306South Africa:– Beverages 1,026 1,102 1,062 956 958 708– Hotels and Gaming 141 100 84 73 81 53Corporate (94) (101) (86) (82) (85) (57)Group 4,141 3,591 2,941 2,389 2,409 1,893Overview Operating and financial review Governance Financial statements Shareholder informationFive-year financial review 147<strong>SABMiller</strong> plc <strong>Annual</strong> <strong>Report</strong> 2008