Notes to the consolidated financial statementscontinued1. Accounting policies continuedfunds. Actuarial gains and losses arising from experienceadjustments, and changes in actuarial assumptions arerecognised in full as they arise outside the income statementand are presented in the statement of recognised incomeand expense. These obligations are valued annually byindependent qualified actuaries.(vii) Termination benefitsTermination benefits are payable when employment isterminated before the normal retirement date, or whenever anemployee accepts voluntary redundancy in exchange for thesebenefits. The group recognises termination benefits when it isdemonstrably committed to terminating the employment of currentemployees according to a detailed formal plan without possibilityof withdrawal, or providing termination benefits as a result ofan offer made to encourage voluntary redundancy. Benefitsfalling due more than 12 months after balance sheet date arediscounted to present value in a similar manner to all long-termemployee benefits.x) Derivative financial instruments – hedge accountingFinancial assets and financial liabilities at fair value through profitor loss include all derivative financial instruments. The derivativeinstruments used by the group, which are used solely for hedgingpurposes (i.e. to offset foreign exchange and interest rate risks),comprise interest rate swaps, cross currency swaps and forwardforeign exchange contracts. Such derivative instruments are usedto alter the risk profile of an existing underlying exposure of thegroup in line with the group’s risk management policies. Thegroup also has derivatives embedded in other contracts primarilycross border foreign currency supply contracts for raw materials.Derivatives are initially recorded at fair value on the date a derivativecontract is entered into and are subsequently re-measured at theirfair value. The method of recognising the resulting gain or lossdepends on whether the derivative is designated as a hedginginstrument, and if so, the nature of the hedging relationship.In order to qualify for hedge accounting, the group is requiredto document at inception, the relationship between the hedgeditem and the hedging instrument as well as its risk managementobjectives and strategy for undertaking hedging transactions.The group is also required to document and demonstrate that therelationship between the hedged item and the hedging instrumentwill be highly effective. This effectiveness test is re-performed ateach period end to ensure that the hedge has remained and willcontinue to remain highly effective.The group designates certain derivatives as either: hedges ofthe fair of recognised assets or liabilities or a firm commitment(fair value hedge); hedges of highly probable forecast transactionsor commitment (cash flow hedge); or hedges of net investmentsin foreign operations (net investment hedge).(i) Fair value hedgesFair value hedges comprise derivative financial instrumentsdesignated in a hedging relationship to manage the group’sinterest rate risk to which the fair value of certain assets andliabilities are exposed. Changes in the fair value of the derivativeoffset the relevant changes in the fair value of the underlyinghedged item attributable to the hedged risk in the incomestatement in the period incurred.Gains or losses on fair value hedges that are regarded as highlyeffective are recorded in the income statement together with thegain or loss on the hedged item attributable to the hedged risk.(ii) Cash flow hedgesCash flow hedges comprise derivative financial instrumentsdesignated in a hedging relationship to manage currency risk towhich the cash flows of certain liabilities are exposed. The effectiveportion of changes in the fair value of the derivative that isdesignated and qualifies for hedge accounting is recognised as aseparate component of equity. The ineffective portion is recognisedimmediately in the income statement. Amounts accumulatedin equity are recycled to the income statement in the period inwhich the hedged item affects profit or loss. However, where aforecasted transaction results in a non-financial asset or liability,the accumulated fair value movements previously deferred inequity are included in the initial cost of the asset or liability.(iii) Hedges of net investments in foreign operationsHedges of net investments in foreign operations compriseeither foreign currency borrowings or derivatives (typically forwardexchange contracts and cross currency swaps) designated ina hedging relationship.Gains or losses on hedging instruments that are regarded ashighly effective are recognised in equity. These largely offsetforeign currency gains or losses arising on the translation of netinvestments that are recorded in equity, in the foreign currencytranslation reserve. The ineffective portion of gains or losses onhedging instruments is recognised immediately in the incomestatement. Amounts accumulated in equity are only recycled tothe income statement upon disposal of the net investment.Where a derivative ceases to meet the criteria of being a hedginginstrument or the underlying exposure which it is hedging is sold,matures or is extinguished, hedge accounting is discontinued.A similar treatment is applied where the hedge is of a futuretransaction and that transaction is no longer likely to occur.Certain derivative instruments, whilst providing effective economichedges under the group’s policies, are not designated as hedges.Changes in the fair value of any derivative instruments that do notqualify or have not been designated as hedges are recognisedimmediately in the income statement. The group does not holdor issue derivative financial instruments for speculative purposes.y) Deposits by customersBottles and containers in circulation are recorded within property,plant and equipment and a corresponding liability is recordedin respect of the obligation to repay the customers’ deposits.Deposits paid by customers for branded returnable containersare reflected in the balance sheet within current liabilities.Any estimated liability that may arise in respect of depositsfor unbranded containers and bottles is shown in provisions.z) Earnings per shareBasic earnings per share represents the profit on ordinaryactivities after taxation attributable to the equity shareholdersof the parent entity, divided by the weighted average number ofordinary shares in issue during the year, less the weighted averagenumber of ordinary shares held in the group’s employee benefittrust during the year.Diluted earnings per share represents the profit on ordinaryactivities after taxation attributable to the equity shareholders,divided by the weighted average number of ordinary shares inissue during the year, less the weighted average number ofordinary shares held in the group’s employee benefit trust duringthe year, plus the weighted average number of dilutive sharesresulting from share options and other potential ordinary sharesoutstanding during the year.74 Notes to the consolidated financial statements<strong>SABMiller</strong> plc <strong>Annual</strong> <strong>Report</strong> 2008
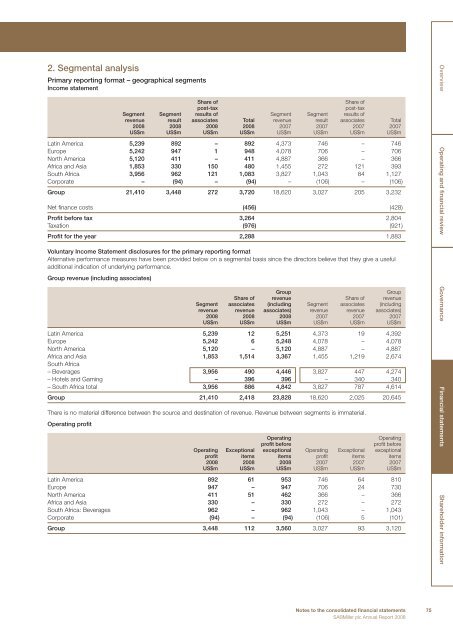
2. Segmental analysisPrimary reporting format – geographical segmentsIncome statementShare ofShare ofpost-taxpost-taxSegment Segment results of Segment Segment results ofrevenue result associates Total revenue result associates Total2008 2008 2008 2008 2007 2007 2007 2007US$m US$m US$m US$m US$m US$m US$m US$mLatin America 5,239 892 – 892 4,373 746 – 746Europe 5,242 947 1 948 4,078 706 – 706North America 5,120 411 – 411 4,887 366 – 366Africa and Asia 1,853 330 150 480 1,455 272 121 393South Africa 3,956 962 121 1,083 3,827 1,043 84 1,127Corporate – (94) – (94) – (106) – (106)Group 21,410 3,448 272 3,720 18,620 3,027 205 3,232Net finance costs (456) (428)Profit before tax 3,264 2,804Taxation (976) (921)Profit for the year 2,288 1,883Voluntary Income Statement disclosures for the primary reporting formatAlternative performance measures have been provided below on a segmental basis since the directors believe that they give a usefuladditional indication of underlying performance.Group revenue (including associates)GroupGroupShare of revenue Share of revenueSegment associates (including Segment associates (includingrevenue revenue associates) revenue revenue associates)2008 2008 2008 2007 2007 2007US$m US$m US$m US$m US$m US$mLatin America 5,239 12 5,251 4,373 19 4,392Europe 5,242 6 5,248 4,078 – 4,078North America 5,120 – 5,120 4,887 – 4,887Africa and Asia 1,853 1,514 3,367 1,455 1,219 2,674South Africa– Beverages 3,956 490 4,446 3,827 447 4,274– Hotels and Gaming – 396 396 – 340 340– South Africa total 3,956 886 4,842 3,827 787 4,614Group 21,410 2,418 23,828 18,620 2,025 20,645There is no material difference between the source and destination of revenue. Revenue between segments is immaterial.Operating profitOperatingOperatingprofit beforeprofit beforeOperating Exceptional exceptional Operating Exceptional exceptionalprofit items items profit items items2008 2008 2008 2007 2007 2007US$m US$m US$m US$m US$m US$mLatin America 892 61 953 746 64 810Europe 947 – 947 706 24 730North America 411 51 462 366 – 366Africa and Asia 330 – 330 272 – 272South Africa: Beverages 962 – 962 1,043 – 1,043Corporate (94) – (94) (106) 5 (101)Group 3,448 112 3,560 3,027 93 3,120Overview Operating and financial review Governance Financial statements Shareholder informationNotes to the consolidated financial statements 75<strong>SABMiller</strong> plc <strong>Annual</strong> <strong>Report</strong> 2008