Reference Manual BioTrak Datalink and Gas ... - Biodownloads
Reference Manual BioTrak Datalink and Gas ... - Biodownloads
Reference Manual BioTrak Datalink and Gas ... - Biodownloads
- No tags were found...

Create successful ePaper yourself
Turn your PDF publications into a flip-book with our unique Google optimized e-Paper software.
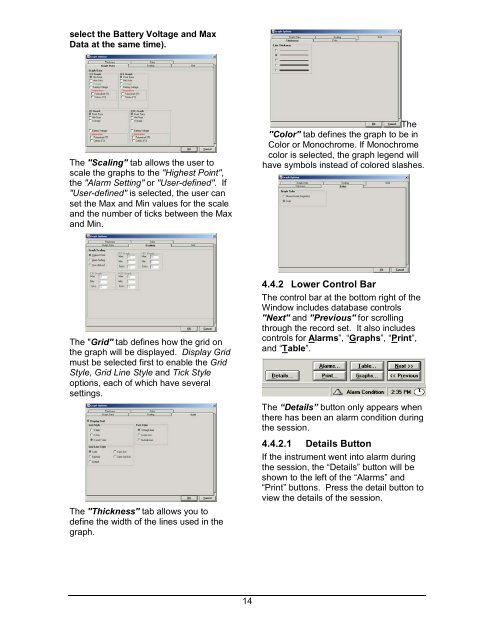
select the Battery Voltage <strong>and</strong> MaxData at the same time).The "Scaling" tab allows the user toscale the graphs to the "Highest Point",the "Alarm Setting" or "User-defined". If"User-defined" is selected, the user canset the Max <strong>and</strong> Min values for the scale<strong>and</strong> the number of ticks between the Max<strong>and</strong> Min.The"Color" tab defines the graph to be inColor or Monochrome. If Monochromecolor is selected, the graph legend willhave symbols instead of colored slashes.The "Grid" tab defines how the grid onthe graph will be displayed. Display Gridmust be selected first to enable the GridStyle, Grid Line Style <strong>and</strong> Tick Styleoptions, each of which have severalsettings.The "Thickness" tab allows you todefine the width of the lines used in thegraph.4.4.2 Lower Control BarThe control bar at the bottom right of theWindow includes database controls"Next" <strong>and</strong> "Previous" for scrollingthrough the record set. It also includescontrols for Alarms”, “Graphs”, “Print”,<strong>and</strong> “Table”.The “Details” button only appears whenthere has been an alarm condition duringthe session.4.4.2.1 Details ButtonIf the instrument went into alarm duringthe session, the “Details” button will beshown to the left of the “Alarms” <strong>and</strong>“Print” buttons. Press the detail button toview the details of the session.14