<strong>VTB</strong> <strong>Annual</strong> Report <strong>2011</strong>4. Management <strong>report</strong>48In <strong>2011</strong>, <strong>VTB</strong> Bank (Austria) and <strong>VTB</strong> Bank (France)launched an innovative retail product for <strong>VTB</strong> Group– <strong>VTB</strong> Direct, an electronic savings deposit account.The new banking product was offered to individualcustomers in France, Austria and Germany, andapproximately EUR 504 million was deposited byindividuals during the <strong>report</strong>ing period.The Russian Commercial Bank (Cyprus), <strong>VTB</strong>’ssubsidiary in Cyprus also focused on thedevelopment of corporate lending. As at the end ofthe <strong>report</strong>ing period, the bank’s loan portfolio morethan doubled from USD 5.3 billon to USD 11.5 billion.Business in Asia and AfricaThe main objective of <strong>VTB</strong> Group’s bankingoperations in Asia and Africa is to establish strongpartner relationships with companies from Russiaand the CIS that operate in these markets, and withlocal businesses looking to expand into the CIS.<strong>VTB</strong> Bank Branch in Shanghai was launched in March2008 and is currently the only bank from Russiaand the CIS, that has a banking licence in China.It aims to provide support to <strong>VTB</strong>’s large corporateclients in China and facilitate access to the Chinesecapital markets for CIS companies and banks. Thebranch has been active in trade finance transactions,servicing Russian importers and exporters, and inlending to the subsidiaries of Russian businessesin China. The bank is also expanding its Chineseenterprise customer base, particularly those whocooperate with Russian and CIS companies, andprovides a full range of trade finance services inpartnership with <strong>VTB</strong> Group’s banks.The branch places particular emphasis on thedevelopment of operations in national currencies.The branch received official confirmation of its marketmaker status from the People’s Bank of China, markinga milestone for the Bank at the end of 2010.This unique status allows the branch to participate inthe setting of rouble/yuan exchange rates and conductoperations on the China Foreign Exchange Trade System(CFETS). As at the end of <strong>2011</strong>, the <strong>VTB</strong> Bank Branchin Shanghai was acknowledged as the market makerwith the largest number and volume of transactions forthe rouble/yuan currency pair. It was also named theforex market participant who demonstrated the mostdynamic development in <strong>2011</strong> by CFETS.During the <strong>report</strong>ing period, the branch played a majorrole in maintaining rouble liquidity in the Chinesemarket, as it provided Chinese banks with a full rangeof services for rouble-denominated bank accounts andforeign exchange operations within China.In <strong>2011</strong>, <strong>VTB</strong> Bank Branch in Shanghai also met allthe necessary regulatory requirements to obtainpermission for conducting transactions using theyuan currency. Presently, the branch conductstransactions in roubles and freely convertiblecurrency and plans to obtain permission that wouldenable it to conduct transactions in yuan in 2012.In <strong>2011</strong>, the branch also launched Internet bankingservices, enabling it to expand its cooperation withcustomers across China from a single sales point.The joint Russian-Angolan bank, Banco <strong>VTB</strong> AfricaS.A. (<strong>VTB</strong>-Africa), has been a success since its launchin 2007. <strong>VTB</strong>-Africa has worked hard to attract newclients and develop transactional banking experience,primarily international settlements, trade finance,currency exchange and working capital loans. In<strong>2011</strong>, the bank operated in line with the businessdevelopment strategy approved for <strong>VTB</strong>-Africa in 2010.A new organisational structure was therefore developedand a number of business priorities were defined. As aresult, the bank increased its client business volumesand it built a high-quality loan portfolio.In <strong>2011</strong>, new grounds were established to furtherdevelop the Vietnam-Russia Joint Venture Bank (VRB),whose mandate is to provide reliable support toRussian companies operating in the SoutheastAsian markets. To increase its market representationand create a convenient infrastructure to serviceRussian and Vietnamese companies, VRB has beenfocusing on the development of its sales network.Currently, it consists of the head office in Hanoi, fivebranches in Vung Tau, Ho Chi Minh, Da Nang, NhaTrang and Hai Phong; it has centres that deal withspecific transactions and card requests; as well asan extensive network of additional offices in thecountry’s economic centres of Hanoi, Ho Chi Minh,Vung Tau; and it also has a wholly-owned subsidiarybank in Moscow. The Bank also plans to launchbranches in Can Tho and Vinh. VRB is a universalcommercial bank providing an extensive rangeof banking products and services for Vietnameseand Russian companies, such as debt and projectfinancing, import and export financing, trade financeand other products, including those, which are newto the Vietnamese market.<strong>VTB</strong> Bank Branch in New Delhi (India) is the flagshipof Russian banking in the country. Its key objective isto become an intermediary between both countries’businesses in their cooperation and collaboration,the development of new projects and the opening ofnew markets. The branch focuses on the foreign tradeoperations of Russian companies that operate in India,as well as their subcontractors, and it also servesIndian companies with interests in Russia. The branchhas established a customer base that comprises oflarge Indian and Russian enterprises. The branch’ssolid development is reflected in its financial results.Today, <strong>VTB</strong> Bank Branch in India examinesopportunities to participate in Russian-Indianjoint projects in India in sectors covering technicalmilitary projects, chemicals, metals, energy,agriculture, telecommunications, the developmentof infrastructure and more. The branch is alsoconsidering the prospect of conducting exportand import settlements in national currencies andopportunities are being evaluated to help the branchto structure payments and arrange project financing,involving <strong>VTB</strong>’s subsidiary banks in Ukraine, Belarus,Kazakhstan and Armenia.4.4. Review of financial performance 1Financial highlightsRecord net profit of RUB 90.5 billion in <strong>2011</strong>, up65.1% year-on-year, with ROE of 15.0%, versus10.3% for 2010;Net interest income for <strong>2011</strong> amounted toRUB 227.0 billion, up 32.7% from 2010;Net fee and commission income in <strong>2011</strong> amounted toRUB 39.2 billion, up 58.7% year-on-year;Net interest margin remained stable year-on-year at 5.0%;Cost of risk was at 0.9% of average gross loans in<strong>2011</strong>, versus 1.9% in 2010;Balance sheet improved, due to organic growthand the consolidation of the Bank of Moscow:total gross loan portfolio increased by 50.0% toRUB 4,590.1 billion and customer deposits wereup 62.5% to RUB 3,596.7 billion;Loans-to-deposits ratio improved to 119.6%,compared to 125.9% as at the end of 2010.Profit & loss statement analysisOperating incomeAs at the end of <strong>2011</strong>, <strong>VTB</strong> Group’s operating incomebefore provisions totalled RUB 286.6 billion, anincrease of 29.6% from RUB 221.1 in 2010. Thisdynamic growth resulted primarily from <strong>VTB</strong> receivinggreater income from interest charges, fees andcommission charges, and was also due to the netrecovery of losses on initial recognition of financialinstruments and on loans restructuring.491 This review is based on <strong>VTB</strong> Group’s IFRS consolidated financial statements for the years ended 31 December <strong>2011</strong> and 2010.
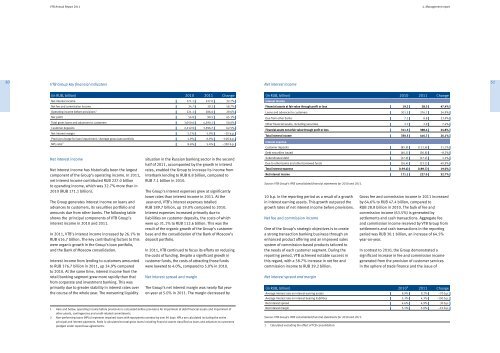
<strong>VTB</strong> <strong>Annual</strong> Report <strong>2011</strong>4. Management <strong>report</strong>50<strong>VTB</strong> Group key financial indicatorsNet interest income51(in RUB, billion) 2010 <strong>2011</strong> ChangeNet interest income 171.1 227.0 32.7%Net fee and commission income 24.7 39.2 58.7%Operating income before provisions 1 221.1 286.6 29.6%Net profit 54.8 90.5 65.1%Total gross loans and advances to customers 3,059.6 4,590.1 50.0%Customer deposits 2,212.9 3,596.7 62.5%Net interest margin 5.1% 5.0% –10 b.p.Provision charge for loan impairment / Average gross loan portfolio 1.9% 0.9% –100 b.p.NPL ratio 2 8.6% 5.4% –320 b.p.Net interest incomeNet interest income has historically been the largestcomponent of the Group’s operating income. In <strong>2011</strong>,net interest income contributed RUB 227.0 billionto operating income, which was 32.7% more than in2010 (RUB 171.1 billion).The Group generates interest income on loans andadvances to customers, its securities portfolio andamounts due from other banks. The following tableshows the principal components of <strong>VTB</strong> Group’sinterest income in 2010 and <strong>2011</strong>.In <strong>2011</strong>, <strong>VTB</strong>’s interest income increased by 26.1% toRUB 416.7 billion. The key contributing factors to thiswere organic growth in the Group’s loan portfolio,and the Bank of Moscow consolidation.Interest income from lending to customers amountedto RUB 376.7 billion in <strong>2011</strong>, up 24.9% comparedto 2010. At the same time, interest income from theretail banking segment grew more rapidly than thatfrom corporate and investment banking. This wasprimarily due to greater stability in interest rates overthe course of the whole year. The worsening liquiditysituation in the Russian banking sector in the secondhalf of <strong>2011</strong>, accompanied by the growth in interestrates, enabled the Group to increase its income frominterbank lending to RUB 8.8 billion, compared toRUB 7.1 billion in 2010.The Group’s interest expenses grew at significantlylower rates than interest income in <strong>2011</strong>. At theyear-end, <strong>VTB</strong>’s interest expenses totalledRUB 189.7 billion, up 19.0% compared to 2010.Interest expenses increased primarily due toliabilities on customer deposits, the costs of whichwere up 31.1% to RUB 112.6 billion. This was theresult of the organic growth of the Group’s customerbase and the consolidation of the Bank of Moscow’sdeposit portfolio.In <strong>2011</strong>, <strong>VTB</strong> continued to focus its efforts on reducingthe costs of funding. Despite a significant growth incustomer funds, the costs of attracting those fundswere lowered to 4.0%, compared to 5.0% in 2010.Net interest spread and marginThe Group’s net interest margin was nearly flat yearon-yearat 5.0% in <strong>2011</strong>. The margin decreased by(in RUB, billion) 2010 <strong>2011</strong> ChangeInterest incomeFinancial assets at fair value through profit or loss 19.2 28.3 47.4%Loans and advances to customers 301.5 376.7 24.9%Due from other banks 7.1 8.8 23.9%Other financial assets, including securities 2.7 2.9 7.4%Financial assets not at fair value through profit or loss 311.3 388.4 24.8%Total interest income 330.5 416.7 26.1%Interest expenseCustomer deposits (85.9) (112.6) 31.1%Debt securities issued (40.1) (36.8) –8.2%Subordinated debt (17.0) (17.2) 1.2%Due to other banks and other borrowed funds (16.4) (23.1) 40.9%Total interest expense (159.4) (189.7) 19.0%Net interest income 171.1 227.0 32.7%Source: <strong>VTB</strong> Group’s IFRS consolidated financial statements for 2010 and <strong>2011</strong>.10 b.p. in the <strong>report</strong>ing period as a result of a growthin interest earning assets. This growth outpaced thegrowth rates of net interest income before provisions.Net fee and commission incomeOne of the Group’s strategic objectives is to createa strong transaction banking business through anenhanced product offering and an improved salessystem of commission-based products tailored tothe needs of each customer segment. During the<strong>report</strong>ing period, <strong>VTB</strong> achieved notable success inthis regard, with a 58.7% increase in net fee andcommission income to RUB 39.2 billion.Net interest spread and marginGross fee and commission income in <strong>2011</strong> increasedby 64.6% to RUB 47.4 billion, compared toRUB 28.8 billion in 2010. The bulk of fee andcommission income (63.5%) is generated bysettlements and cash transactions. Aggregate feeand commission income received by <strong>VTB</strong> Group fromsettlements and cash transactions in the <strong>report</strong>ingperiod was RUB 30.1 billion, an increase of 64.5%year-on-year.In contrast to 2010, the Group demonstrated asignificant increase in fee and commission incomegenerated from the provision of customer servicesin the sphere of trade finance and the issue of(in RUB, billion) 2010 1 <strong>2011</strong> ChangeAverage interest rate on interest earning assets 9.9% 9.2% –70 b.p.Average interest rate on interest bearing liabilities 5.3% 4.3% –100 b.p.Net interest spread 4.6% 4.9% 30 b.p.1 Here and below, operating income before provisions is calculated before provisions for impairment of debt financial assets and impairment ofother assets, contingencies and credit-related commitments.Net interest margin 5.1% 5.0% –10 b.p.2 Non-performing loans (NPLs) represent impaired loans with repayments overdue by over 90 days. NPLs are calculated including the entireprincipal and interest payments. Ratio is calculated to total gross loans including financial assets classified as loans and advances to customersSource: <strong>VTB</strong> Group’s IFRS consolidated financial statements for 2010 and <strong>2011</strong>.pledged under repurchase agreements. 1 Calculated excluding the effect of TCB consolidation.