Annual report 2011 - VTB
Annual report 2011 - VTB
Annual report 2011 - VTB
- No tags were found...

You also want an ePaper? Increase the reach of your titles
YUMPU automatically turns print PDFs into web optimized ePapers that Google loves.
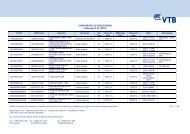
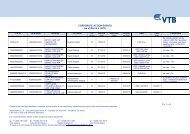
<strong>VTB</strong> <strong>Annual</strong> Report <strong>2011</strong>8. Summary consolidated financial statements in accordance with IFRSConsolidated Statements of Cash Flowsfor the Years Ended 31 December(in billions of Russian Roubles)114<strong>2011</strong> 2010Cash flows from operating activitiesInterest received 382.3 302.6Interest paid (176.4) (158.0)(Loss incurred) / income received on operations with financial instruments at fair value through profit or loss (23.3) 13.9Consolidated Statements of Cash Flows for the Years Ended 31 December(in billions of Russian Roubles)(continued)115Income received / (loss incurred) on dealing in foreign currency 10.8 (7.6)Fees and commissions received 48.0 28.3Fees and commissions paid (7.6) (4.6)Cash flows used in financing activities<strong>2011</strong> 2010Other operating income received 2.0 1.6Dividends paid (7.3) (6.1)Staff costs, administrative expenses paid (122.1) (83.5)Income received from non-banking activities 17.8 7.0Expenses paid in non-banking activities (7.3) (1.8)Income tax paid (28.8) (22.8)Cash flows from operating activities before changes in operating assets and liabilities 95.4 75.1Net decrease / (increase) in operating assetsNet increase in mandatory reserve deposits with central banks (37.3) (0.5)Net decrease in restricted cash – 0.2Net increase in correspondent accounts in precious metals (6.8) (1.6)Net (increase) / decrease in financial assets at fair value through profit or loss (159.8) 42.8Net decrease in due from other banks 11.6 58.4Net increase in loans and advances to customers (971.2) (289.3)Proceeds from issuance of local bonds 21.0 36.1Repayment of local bonds (53.9) (30.7)Buy-back of local bonds (16.7) (33.9)Proceeds from sale of previously bought-back local bonds 14.9 29.7Proceeds from issuance of Eurobonds 45.6 92.4Repayment of Eurobonds (100.8) (11.5)Buy-back of Eurobonds (35.3) (64.1)Proceeds from sale of previously bought-back Eurobonds 33.9 68.3Proceeds from syndicated loans 87.3 0.6Repayment of syndicated loans (43.2) (14.9)Buy-back of syndicated loans (5.9) –Net increase in other assets (44.1) (22.3)Proceeds from other borrowings and funds from local central banks 452.3 275.4Net (decrease) / increase in operating liabilitiesNet increase in due to other banks 232.5 79.8Net increase in customer deposits 832.7 361.5Net increase / (decrease) in debt securities issued other than bonds 78.9 (14.6)Net increase in other liabilities 19.2 7.6Net cash from operating activities 51.1 297.1Cash flows used in investing activitiesDividends received 0.8 0.8Proceeds from sale or redemption of financial assets available-for-sale 58.5 13.3Purchase of financial assets available-for-sale (125.6) (43.9)Purchase of subsidiaries, net of cash acquired 5.8 8.1Disposal of subsidiaries, net of cash disposed (1.1) 0.2Repayment of other borrowings and funds from local central banks (122.7) (562.6)Repayment of subordinated debt – (9.3)Buy-back of subordinated debt (4.8) (0.3)Proceeds from sale of previously bought-back subordinated debt 3.1 0.9Proceeds from sale of treasury shares 1.3 –Purchase of treasury shares (1.6) –Share issue to minorities 0.2 0.3Purchase of non-controlling interests in subsidiaries (34.8) (0.2)Net cash from / (used in) financing activities 232.6 (229.9)Effect of exchange rate changes on cash and cash equivalents 2.6 (1.7)Effect of hyperinflation (1.3) –Purchase of and contributions to associates and joint ventures (109.1) (0.6)Net increase in cash and cash equivalents 124.7 14.0Proceeds from sale of share in associates and joint ventures 6.6 –Purchase of investment securities held-to-maturity (1.2) (0.8)Proceeds from redemption of investment securities held-to-maturity 2.3 1.2Cash and cash equivalents at the beginning of the year 272.8 258.8Cash and cash equivalents at the end of the year 397.5 272.8Purchase of premises and equipment (36.9) (31.3)Proceeds from sale of premises and equipment 40.1 2.9Purchase or construction of investment property (0.3) –Proceeds from sale of investment property 1.3 –Purchase of intangible assets (2.7) (1.4)Proceeds from sale of intangible assets 1.2 –Net cash used in investing activities (160.3) (51.5)These summary consolidated financial statements do not contain all the disclosures required by International Financial Reporting Standards (IFRS),namely summary of principal accounting policies and other explanatory information as presented in the audited consolidated financial statementsof <strong>VTB</strong> Bank and its subsidiaries (together “the Group”) prepared in accordance with IFRS for the years ended 31 December <strong>2011</strong> and 2010.For a better understanding of the Group’s financial position, its financial performance and its cash flows, these summary consolidated financialstatements should be read in conjunction with the audited consolidated financial statements of the Group from which these summary consolidatedfinancial statements were derived. Copies of audited consolidated financial statements can be obtained from <strong>VTB</strong> Bank.