Mathematics Higher Level Robert Joinson
Mathematics Higher Level Robert Joinson
Mathematics Higher Level Robert Joinson
- No tags were found...

You also want an ePaper? Increase the reach of your titles
YUMPU automatically turns print PDFs into web optimized ePapers that Google loves.
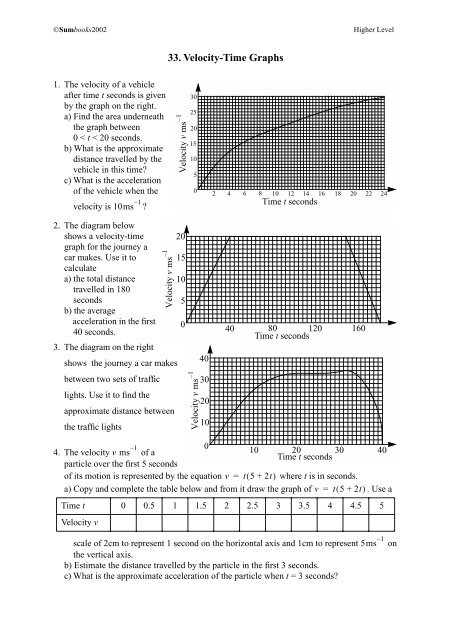
©Sumbooks2002<strong>Higher</strong> <strong>Level</strong>33. Velocity-Time Graphs1. The velocity of a vehicleafter time t seconds is givenby the graph on the right.a) Find the area underneaththe graph between0 < t < 20 seconds.b) What is the approximatedistance travelled by thevehicle in this time?c) What is the accelerationof the vehicle when thevelocity is 10 ms 1 ?Velocity v ms – 13025201510502 4 6 8 10 12 14 16 18 20 22 24Time t seconds2. The diagram belowshows a velocity-timegraph for the journey acar makes. Use it tocalculatea) the total distancetravelled in 180secondsb) the averageacceleration in the first40 seconds.3. The diagram on the rightshows the journey a car makesbetween two sets of trafficlights. Use it to find theapproximate distance betweenthe traffic lights– 0Velocity v ms – 12015105Velocity v ms – 14030201040 80 120 160Time t seconds04. The velocity v ms – 1 of a10 20 30 40Time t secondsparticle over the first 5 secondsof its motion is represented by the equation v = t( 5+2t)where t is in seconds.a) Copy and complete the table below and from it draw the graph of v = t( 5+2t). Use aTime t 0 0.5 1 1.5 2 2.5 3 3.5 4 4.5 5Velocity vscale of 2cm to represent 1 second on the horizontal axis and 1cm to represent 5 ms – 1 onthe vertical axis.b) Estimate the distance travelled by the particle in the first 3 seconds.c) What is the approximate acceleration of the particle when t = 3 seconds?