Mathematics Higher Level Robert Joinson
Mathematics Higher Level Robert Joinson
Mathematics Higher Level Robert Joinson
- No tags were found...

Create successful ePaper yourself
Turn your PDF publications into a flip-book with our unique Google optimized e-Paper software.
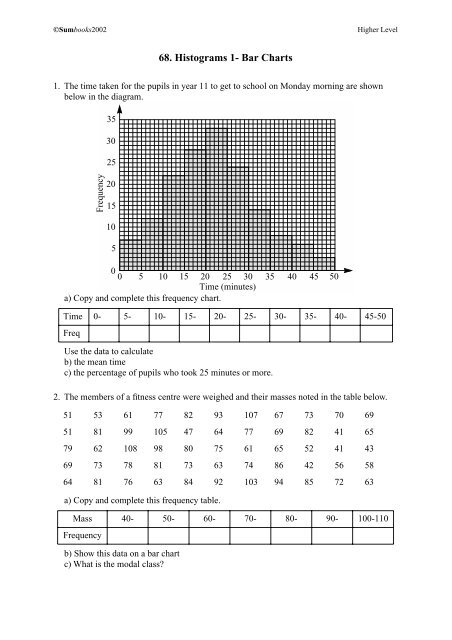
©Sumbooks2002<strong>Higher</strong> <strong>Level</strong>68. Histograms 1- Bar Charts1. The time taken for the pupils in year 11 to get to school on Monday morning are shownbelow in the diagram.353025Frequency201500 5 10 15 20 25 30 35 40 45 50Time (minutes)a) Copy and complete this frequency chart.Time 0- 5- 10- 15- 20- 25- 30- 35- 40- 45-50FreqUse the data to calculateb) the mean timec) the percentage of pupils who took 25 minutes or more.2. The members of a fitness centre were weighed and their masses noted in the table below.51 53 61 77 82 93 107 67 73 70 6951 81 99 105 47 64 77 69 82 41 6579 62 108 98 80 75 61 65 52 41 4369 73 78 81 73 63 74 86 42 56 5864 81 76 63 84 92 103 94 85 72 63a) Copy and complete this frequency table.Mass 40- 50- 60- 70- 80- 90- 100-110Frequency105b) Show this data on a bar chartc) What is the modal class?