Mathematics Higher Level Robert Joinson
Mathematics Higher Level Robert Joinson
Mathematics Higher Level Robert Joinson
- No tags were found...

You also want an ePaper? Increase the reach of your titles
YUMPU automatically turns print PDFs into web optimized ePapers that Google loves.
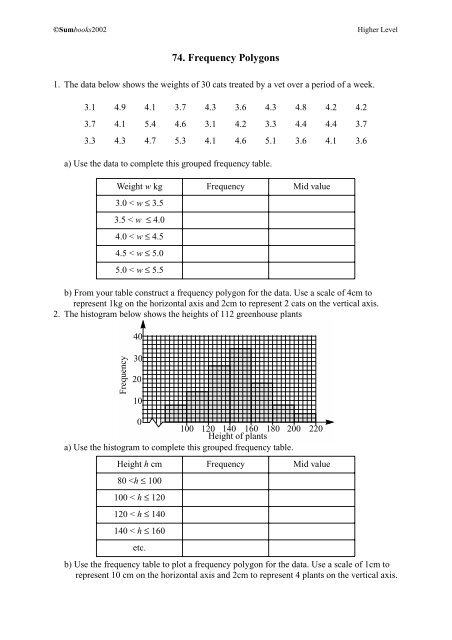
©Sumbooks2002<strong>Higher</strong> <strong>Level</strong>74. Frequency Polygons1. The data below shows the weights of 30 cats treated by a vet over a period of a week.3.1 4.9 4.1 3.7 4.3 3.6 4.3 4.8 4.2 4.23.7 4.1 5.4 4.6 3.1 4.2 3.3 4.4 4.4 3.73.3 4.3 4.7 5.3 4.1 4.6 5.1 3.6 4.1 3.6a) Use the data to complete this grouped frequency table.Weight w kg Frequency Mid value3.0 < w ≤ 3.53.5 < w ≤ 4.04.0 < w ≤ 4.54.5 < w ≤ 5.05.0 < w ≤ 5.5b) From your table construct a frequency polygon for the data. Use a scale of 4cm torepresent 1kg on the horizontal axis and 2cm to represent 2 cats on the vertical axis.2. The histogram below shows the heights of 112 greenhouse plants40Frequency3020100100 120 140 160 180 200 220Height of plantsa) Use the histogram to complete this grouped frequency table.Height h cm Frequency Mid value80