Mathematics Higher Level Robert Joinson
Mathematics Higher Level Robert Joinson
Mathematics Higher Level Robert Joinson
- No tags were found...

You also want an ePaper? Increase the reach of your titles
YUMPU automatically turns print PDFs into web optimized ePapers that Google loves.
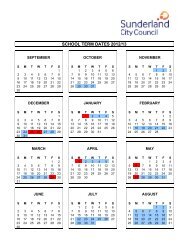
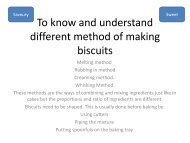
©Sumbooks2002<strong>Higher</strong> <strong>Level</strong>64. Scatter Diagrams1. The table shows the sales of cans of drink from a vending machine, over a period of 12 daysin JuneDay S M T W T F S S M T W TTemp. °C 15 17 20 25 21 18 15 20 23 27 30 29Cans sold 104 113 188 275 212 150 90 205 251 330 425 404a) Construct a scatter diagram of the data and draw on it a line of best fit.b) Approximately how many cans would be sold on a day when the average temperature is22 °C ?2. Timothy’s old freezer registers –4 °C , which is higher than it should be so he buys a newone. The diagram shows the temperature inside the new freezer after he has started it up.Temperature °C20x10xxxxTime0x1:00 02:00 03:00 04:00x05:00 06:00xx–10x–20The freezer is switched on at 1:00pm and he takes the temperature every 30 minutes.a) At what time would you expect it to reach its minimum temperature of –20 °C ?b) He missed taking the temperature at 03:30. What was the approximate temperature?c) Tim transfers food from his old freezer to the new one when both the temperatures areequal. At approximately what time does he do this?3. A lorry can carry up to 20 tonnes of sand. The lorry moves sand from the quarry to acollection point 2km away. The times it takes for 10 deliveries are shown in the table below.Draw a scatter graph of the data showing a line of best fit.Time taken (minutes) 5.0 4.5 3.5 3.7 4.8 4.3 4.1 4.0 3.6 4.2Amount of sand (tonnes) 10 14 20 18 13 15 17 16 19 17a) What weight of sand would take approximately 4 minutes 20 seconds to deliver?b) How long would a load of 16 tonnes take to deliver?