Mathematics Higher Level Robert Joinson
Mathematics Higher Level Robert Joinson
Mathematics Higher Level Robert Joinson
- No tags were found...

Create successful ePaper yourself
Turn your PDF publications into a flip-book with our unique Google optimized e-Paper software.
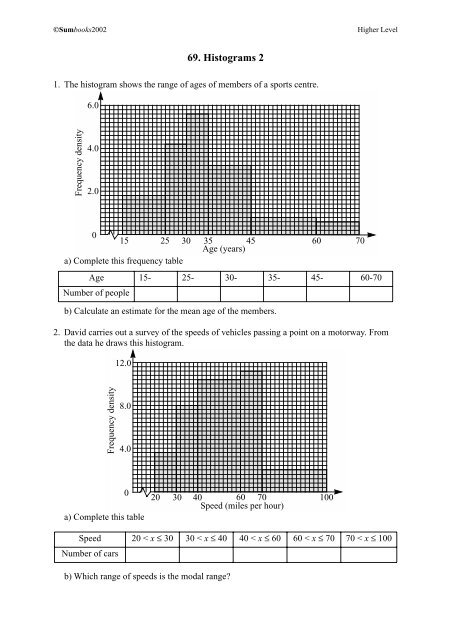
©Sumbooks2002<strong>Higher</strong> <strong>Level</strong>69. Histograms 21. The histogram shows the range of ages of members of a sports centre.6.0Frequency density4.02.0015 25 30 35 45 60Age (years)a) Complete this frequency tableAge 15- 25- 30- 35- 45- 60-70Number of peopleb) Calculate an estimate for the mean age of the members.2. David carries out a survey of the speeds of vehicles passing a point on a motorway. Fromthe data he draws this histogram.12.070Frequency density8.04.00a) Complete this table20 30 40 60 70 100Speed (miles per hour)Speed 20 < x ≤ 30 30 < x ≤ 40 40 < x ≤ 60 60 < x ≤ 70 70 < x ≤ 100Number of carsb) Which range of speeds is the modal range?