Mathematics Higher Level Robert Joinson
Mathematics Higher Level Robert Joinson
Mathematics Higher Level Robert Joinson
- No tags were found...

Create successful ePaper yourself
Turn your PDF publications into a flip-book with our unique Google optimized e-Paper software.
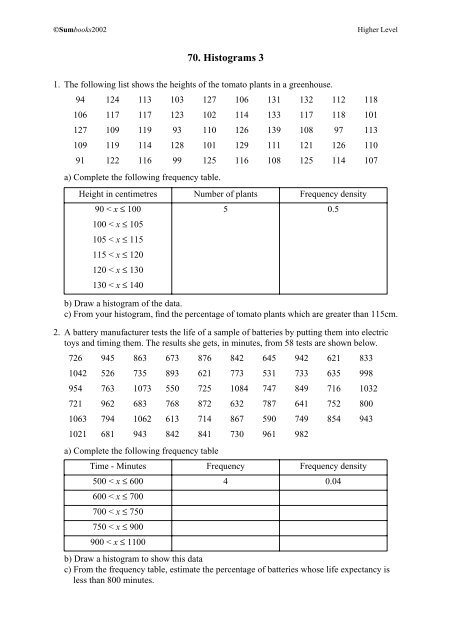
©Sumbooks2002<strong>Higher</strong> <strong>Level</strong>70. Histograms 31. The following list shows the heights of the tomato plants in a greenhouse.94 124 113 103 127 106 131 132 112 118106 117 117 123 102 114 133 117 118 101127 109 119 93 110 126 139 108 97 113109 119 114 128 101 129 111 121 126 11091 122 116 99 125 116 108 125 114 107a) Complete the following frequency table.Height in centimetres Number of plants Frequency density90 < x ≤ 100 5 0.5100 < x ≤ 105105 < x ≤ 115115 < x ≤ 120120 < x ≤ 130130 < x ≤ 140b) Draw a histogram of the data.c) From your histogram, find the percentage of tomato plants which are greater than 115cm.2. A battery manufacturer tests the life of a sample of batteries by putting them into electrictoys and timing them. The results she gets, in minutes, from 58 tests are shown below.726 945 863 673 876 842 645 942 621 8331042 526 735 893 621 773 531 733 635 998954 763 1073 550 725 1084 747 849 716 1032721 962 683 768 872 632 787 641 752 8001063 794 1062 613 714 867 590 749 854 9431021 681 943 842 841 730 961 982a) Complete the following frequency tableTime - Minutes Frequency Frequency density500 < x ≤ 600 4 0.04600 < x ≤ 700700 < x ≤ 750750 < x ≤ 900900 < x ≤ 1100b) Draw a histogram to show this datac) From the frequency table, estimate the percentage of batteries whose life expectancy isless than 800 minutes.