Q150T S/E/ES Sample Preparation System Instruction Manual
Q150T S/E/ES Sample Preparation System Instruction Manual
Q150T S/E/ES Sample Preparation System Instruction Manual

Create successful ePaper yourself
Turn your PDF publications into a flip-book with our unique Google optimized e-Paper software.
6.6.3 Network Troubleshooting<br />
<strong>Q150T</strong> <strong>Sample</strong> <strong>Preparation</strong> <strong>System</strong><br />
If the connection fails, check that the first three numbers in the IP addresses of the<br />
instrument and the computer are the same. Check the firewall settings.<br />
The Q150 will only support one connection. For example, it will not allow simultaneous<br />
connections to Internet Explorer and Windows Explorer.<br />
6.7 Process Logging<br />
To view the process log, listing the profiles run on the Q300TD:<br />
1. With the system at the Standby screen (see Figure 3-1), tap on Service.<br />
2. From the displayed Service menu, tap on Process Log.<br />
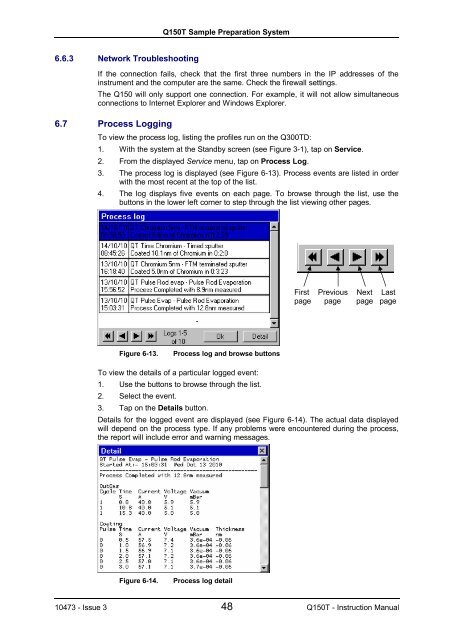
3. The process log is displayed (see Figure 6-13). Process events are listed in order<br />
with the most recent at the top of the list.<br />
4. The log displays five events on each page. To browse through the list, use the<br />
buttons in the lower left corner to step through the list viewing other pages.<br />
Figure 6-13. Process log and browse buttons<br />
To view the details of a particular logged event:<br />
1. Use the buttons to browse through the list.<br />
2. Select the event.<br />
3. Tap on the Details button.<br />
Details for the logged event are displayed (see Figure 6-14). The actual data displayed<br />
will depend on the process type. If any problems were encountered during the process,<br />
the report will include error and warning messages.<br />
Figure 6-14. Process log detail<br />
First Previous Next Last<br />
page page page page<br />
10473 - Issue 3 48 <strong>Q150T</strong> - <strong>Instruction</strong> <strong>Manual</strong>