MS Thesis R. Hager - Hawaii National Marine Renewable Energy ...
MS Thesis R. Hager - Hawaii National Marine Renewable Energy ...
MS Thesis R. Hager - Hawaii National Marine Renewable Energy ...
- No tags were found...

You also want an ePaper? Increase the reach of your titles
YUMPU automatically turns print PDFs into web optimized ePapers that Google loves.
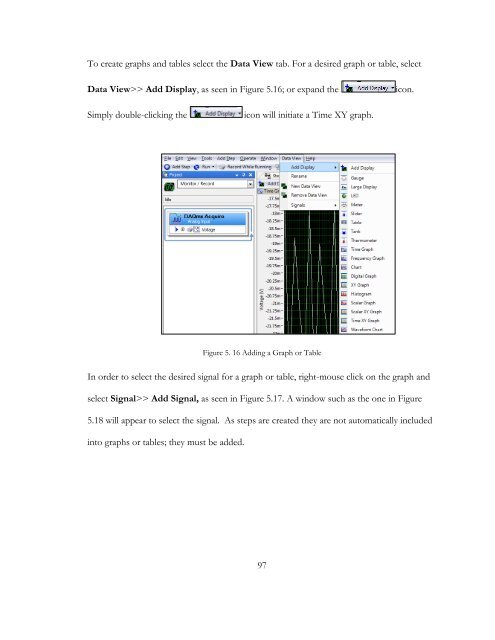
To create graphs and tables select the Data View tab. For a desired graph or table, selectData View>> Add Display, as seen in Figure 5.16; or expand theicon.Simply double-clicking theicon will initiate a Time XY graph.Figure 5. 16 Adding a Graph or TableIn order to select the desired signal for a graph or table, right-mouse click on the graph andselect Signal>> Add Signal, as seen in Figure 5.17. A window such as the one in Figure5.18 will appear to select the signal. As steps are created they are not automatically includedinto graphs or tables; they must be added.97