


You also want an ePaper? Increase the reach of your titles
YUMPU automatically turns print PDFs into web optimized ePapers that Google loves.
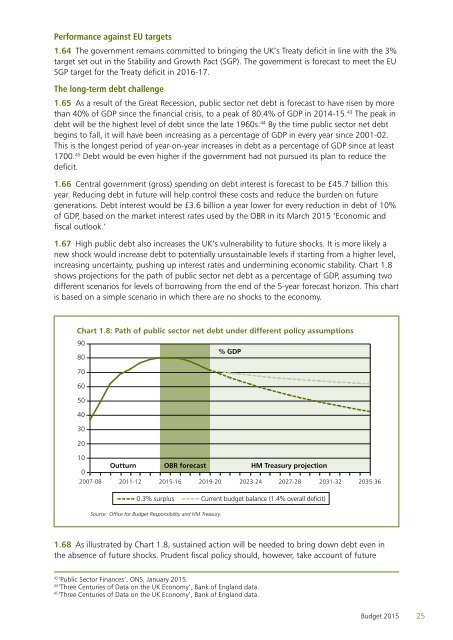
Performance against EU targets1.64 The government remains committed to bringing the UK’s Treaty deficit in line with the 3%target set out in the Stability and Growth Pact (SGP). The government is forecast to meet the EUSGP target for the Treaty deficit in 2016-17.The long-term debt challenge1.65 As a result of the Great Recession, public sector net debt is forecast to have risen by morethan 40% of GDP since the financial crisis, to a peak of 80.4% of GDP in 2014-15. 43 The peak indebt will be the highest level of debt since the late 1960s. 44 By the time public sector net debtbegins to fall, it will have been increasing as a percentage of GDP in every year since 2001-02.This is the longest period of year-on-year increases in debt as a percentage of GDP since at least1700. 45 Debt would be even higher if the government had not pursued its plan to reduce thedeficit.1.66 Central government (gross) spending on debt interest is forecast to be £45.7 billion thisyear. Reducing debt in future will help control these costs and reduce the burden on futuregenerations. Debt interest would be £3.6 billion a year lower for every reduction in debt of 10%of GDP, based on the market interest rates used by the OBR in its March <strong>2015</strong> ‘Economic andfiscal outlook.’1.67 High public debt also increases the UK’s vulnerability to future shocks. It is more likely anew shock would increase debt to potentially unsustainable levels if starting from a higher level,increasing uncertainty, pushing up interest rates and undermining economic stability. Chart 1.8shows projections for the path of public sector net debt as a percentage of GDP, assuming twodifferent scenarios for levels of borrowing from the end of the 5-year forecast horizon. This chartis based on a simple scenario in which there are no shocks to the economy.Chart 1.8: Path of public sector net debt under different policy assumptions9080% GDP706050403020100Outturn OBR forecast HM Treasury projection2007-08 2011-12 <strong>2015</strong>-16 2019-20 2023-24 2027-28 2031-32 2035-360.3% surplusCurrent budget balance (1.4% overall deficit)Source: Office for <strong>Budget</strong> Responsibility and HM Treasury.1.68 As illustrated by Chart 1.8, sustained action will be needed to bring down debt even inthe absence of future shocks. Prudent fiscal policy should, however, take account of future43‘Public Sector Finances’, ONS, January <strong>2015</strong>.44‘Three Centuries of Data on the UK Economy’, Bank of England data.45‘Three Centuries of Data on the UK Economy’, Bank of England data.<strong>Budget</strong> <strong>2015</strong>25