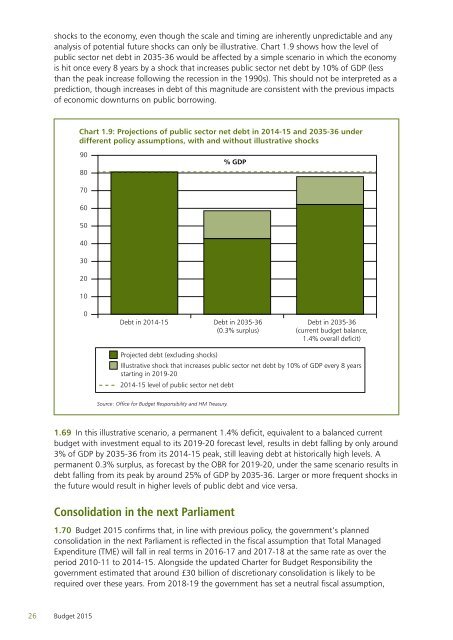
shocks to the economy, even though the scale and timing are inherently unpredictable and anyanalysis of potential future shocks can only be illustrative. Chart 1.9 shows how the level ofpublic sector net debt in 2035-36 would be affected by a simple scenario in which the economyis hit once every 8 years by a shock that increases public sector net debt by 10% of GDP (lessthan the peak increase following the recession in the 1990s). This should not be interpreted as aprediction, though increases in debt of this magnitude are consistent with the previous impactsof economic downturns on public borrowing.Chart 1.9: Projections of public sector net debt in 2014-15 and 2035-36 underdifferent policy assumptions, with and without illustrative shocks9080% GDP706050403020100Debt in 2014-15 Debt in 2035-36(0.3% surplus)Debt in 2035-36(current budget balance,1.4% overall deficit)Projected debt (excluding shocks)Illustrative shock that increases public sector net debt by 10% of GDP every 8 yearsstarting in 2019-202014-15 level of public sector net debtSource: Office for <strong>Budget</strong> Responsibility and HM Treasury.1.69 In this illustrative scenario, a permanent 1.4% deficit, equivalent to a balanced currentbudget with investment equal to its 2019-20 forecast level, results in debt falling by only around3% of GDP by 2035-36 from its 2014-15 peak, still leaving debt at historically high levels. Apermanent 0.3% surplus, as forecast by the OBR for 2019-20, under the same scenario results indebt falling from its peak by around 25% of GDP by 2035-36. Larger or more frequent shocks inthe future would result in higher levels of public debt and vice versa.Consolidation in the next Parliament1.70 <strong>Budget</strong> <strong>2015</strong> confirms that, in line with previous policy, the government’s plannedconsolidation in the next Parliament is reflected in the fiscal assumption that Total ManagedExpenditure (TME) will fall in real terms in 2016-17 and 2017-18 at the same rate as over theperiod 2010-11 to 2014-15. Alongside the updated Charter for <strong>Budget</strong> Responsibility thegovernment estimated that around £30 billion of discretionary consolidation is likely to berequired over these years. From 2018-19 the government has set a neutral fiscal assumption,26 <strong>Budget</strong> <strong>2015</strong>
holding TME flat in real terms in 2018-19 and in 2019-20 increasing TME in line with nominalGDP.1.71 The government will continue to prioritise capital investment. At Spending Round 2013,the government set out a long-term pipeline of capital investment worth more than £100 billionover the next Parliament. Autumn Statement 2014 set out in detail how over £30 billion of thismoney will be invested in Britain’s infrastructure and growth promoting sectors, including roads,flood and coastal defences, and science. The government will continue to hold public sectorgross investment (PSGI) constant in real terms in 2016-17 and 2017-18, and it will increase inline with GDP from 2018-19.1.72 The fiscal assumption for 2016-17, 2017-18, 2018-19 and 2019-20 is expressed in termsof TME. It would, of course, be possible to do more of this further consolidation through taxinstead.1.73 The government’s fiscal assumption for the years 2016-17 to 2019-20 set out above,combined with the OBR’s forecast for Annually Managed Expenditure (AME) (excludingAME policy decisions in this <strong>Budget</strong>) and the PSGI assumption give projections for impliedDepartmental Expenditure Limits (DEL) including depreciation. The projections for impliedDEL including depreciation at this <strong>Budget</strong> are higher in each year over 2016-17 to 2019-20compared with Autumn Statement 2014. Table 2.4 provides a more detailed summary of theimplied DEL forecast at this <strong>Budget</strong> and the cost of spending policy measures.Delivering on future consolidation plans1.74 Choices will need to be made on the composition of further consolidation in the nextParliament, including funding any new commitments. The <strong>Budget</strong> provides further detail onsome of these choices.1.75 To deliver the necessary reductions in spending, the government will continue to identifyand deliver significant efficiency savings. At Autumn Statement 2014 the government setout an aspiration to find £10 billion in further efficiency savings by 2017-18. This included acommitment to be much more ambitious in the use of digital technology.1.76 <strong>Budget</strong> <strong>2015</strong> announces that the digital ambition will extend beyond centralgovernment and arms-length bodies, to consider local services. HM Treasury, theDepartment for Communities and Local Government and the Government Digital Service willcollaborate with partners in local government, as the sector develops a set of proposals that willenable more customer-focussed, digitally-enabled and efficient local services in time to informfuture budget allocations.1.77 In this Parliament the government has delivered significant savings from centralising theprocurement of goods and services. <strong>Budget</strong> <strong>2015</strong> announces that, following a successfultrial, the government will implement ‘GOV.UK Verify’ – a new way for people to provetheir identity online when using government services – across central government.This means that departments will use the same tool for their digital services, reducingduplication. Further, to prevent individual departments paying different amounts to either buildtheir own data centres or outsource this service, the government will create a joint venture tohost departments’ non-cloud based servers, which could save up to £100 million. 461.78 In education, evidence shows that the best performing schools focus their spending onteachers over the ‘back-office’. 47 However, spending on back-office costs varies from £202 to£1,432 per pupil, and between 2003 and 2013 back-office spending per pupil in maintainedschools increased by around 60% in real terms. 48 To help schools further improve their efficiency46Cabinet Office business case analysis, February <strong>2015</strong>.47‘Review of efficiency in the schools system’, Department for Education, June 2013.48‘Review of efficiency in the schools system’, Department for Education, June 2013; HM Treasury calculations basedon Local Authority and School Expenditure 2002-03 and 2012-13. The 2012-13 data is available at gov.uk.<strong>Budget</strong> <strong>2015</strong>27