Here - Meta Marketing e Eventos
Here - Meta Marketing e Eventos
Here - Meta Marketing e Eventos
- No tags were found...

You also want an ePaper? Increase the reach of your titles
YUMPU automatically turns print PDFs into web optimized ePapers that Google loves.
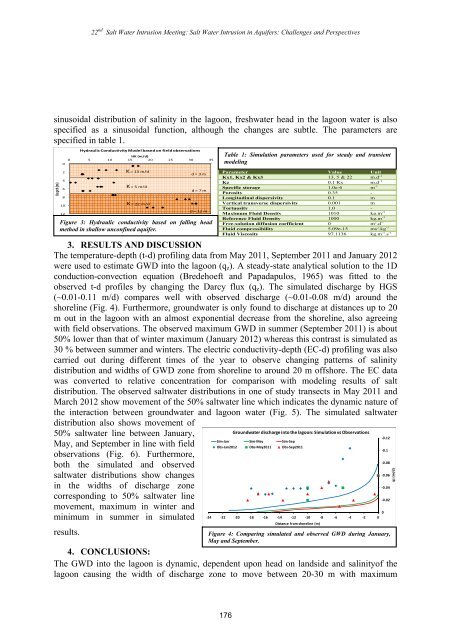
22 nd Salt Water Intrusion Meeting: Salt Water Intrusion in Aquifers: Challenges and Perspectivessinusoidal distribution of salinity in the lagoon, freshwater head in the lagoon water is alsospecified as a sinusoidal function, although the changes are subtle. The parameters arespecified in table 1.HydraulicConductivityModelbasedonfieldobservationsHK(m/d)0 5 10 15 20 25 30 350Table 1: Simulation parameters used for steady and transientmodelingDepth(m)24681012K=13m/dK=5m/dK=22m/dd=3md=7md=12mFigure 3: Hydraulic conductivity based on falling headmethod in shallow unconfined aquifer.Parameter Value UnitKx1, Kx2 & Kx3 13, 5 & 22 m.d -1Kz 0.1 Kx m.d -1Specific storage 1.0e-6 m -1Porosity 0.35 -Longitudinal dispersivity 0.1 mVertical transverse dispersivity 0.001 mTortuosity 1.0 -Maximum Fluid Density 1010 kg.m -3Reference Fluid Density 1000 kg.m -3Free-solution diffusion coefficient 0 m 2 .d -1Fluid compressibility 5.09e-15 ms 2 .kg -1Fluid Viscosity 97.1136 kg.m -1 .s -13. RESULTS AND DISCUSSIONThe temperature-depth (t-d) profiling data from May 2011, September 2011 and January 2012were used to estimate GWD into the lagoon (q z ). A steady-state analytical solution to the 1Dconduction-convection equation (Bredehoeft and Papadapulos, 1965) was fitted to theobserved t-d profiles by changing the Darcy flux (q z ). The simulated discharge by HGS(~0.01-0.11 m/d) compares well with observed discharge (~0.01-0.08 m/d) around theshoreline (Fig. 4). Furthermore, groundwater is only found to discharge at distances up to 20m out in the lagoon with an almost exponential decrease from the shoreline, also agreeingwith field observations. The observed maximum GWD in summer (September 2011) is about50% lower than that of winter maximum (January 2012) whereas this contrast is simulated as30 % between summer and winters. The electric conductivity-depth (EC-d) profiling was alsocarried out during different times of the year to observe changing patterns of salinitydistribution and widths of GWD zone from shoreline to around 20 m offshore. The EC datawas converted to relative concentration for comparison with modeling results of saltdistribution. The observed saltwater distributions in one of study transects in May 2011 andMarch 2012 show movement of the 50% saltwater line which indicates the dynamic nature ofthe interaction between groundwater and lagoon water (Fig. 5). The simulated saltwaterdistribution also shows movement of50% saltwater line between January,Groundwaterdischargeintothelagoon:SimulationvsObservations0.12SimJan SimMay SimSepMay, and September in line with fieldObsJan2012 ObsMay2011 ObsSep20110.1observations (Fig. 6). Furthermore,0.08both the simulated and observedsaltwater distributions show changes0.06in the widths of discharge zone0.04corresponding to 50% saltwater line0.02movement, maximum in winter and0minimum in summer in simulated 24 22 20 18 16 14 12 10 8 6 4 2 0results.Distancefromshoreline(m)Figure 4: Comparing simulated and observed GWD during January,May and September.4. CONCLUSIONS:The GWD into the lagoon is dynamic, dependent upon head on landside and salinityof thelagoon causing the width of discharge zone to move between 20-30 m with maximumqz(m/d)176